
Will demand slow?
Many Logisticians have been working overtime in the past 18 months to meet their CEOs instructions to provide sufficient products for the ‘new’ demand. But, there are signs that the ‘good times’ may come to an end, with a potential reduction in consumer demand.
Consumers may have purchased sufficient ‘stuff’ – where to put it? The abnormal increase for house prices in some countries means increased mortgage repayments for a section of the population. Inflation may not be ‘transitory’ and lead to increased interest rates. Increased prices for ‘in-demand’ products, such as fuel. The IMF expects oil prices to increase by nearly 60 percent in 2021 compared to 2020 and non-oil commodity prices (agriculture and metals) could increase by nearly 30 percent.
A sudden reduction in demand will have CEOs demanding inventories be cut by ‘x’ percent. But, it would be better if Logisticians had the figures to show the ‘right’ amount of inventories for the business.
Mapping physical flows
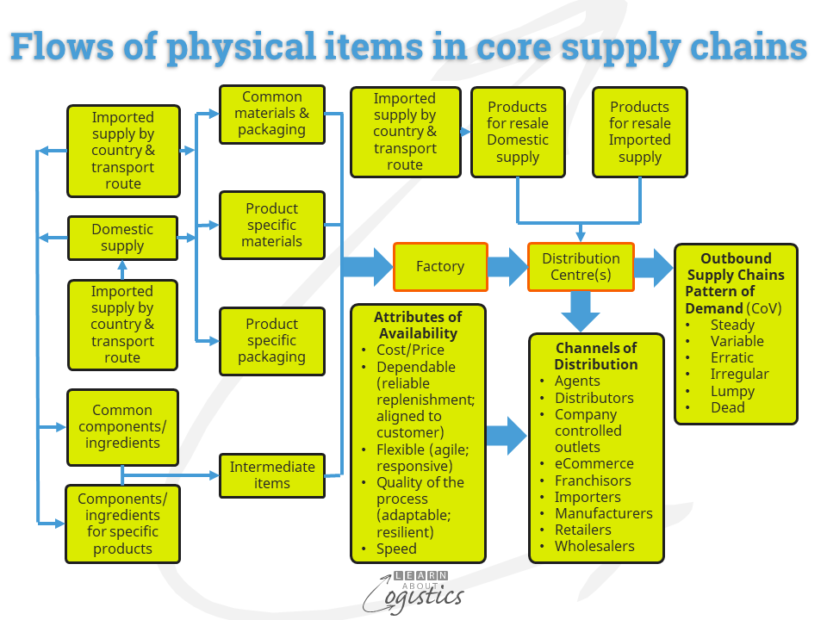
The diagram below illustrates the multiple inbound and outbound supply chains that are possible, but the actual range in a business is likely to be less. Although items flow towards the end user, it is the pattern of demand for products that govern planning of the flows. The right side of the diagram shows a list of the Patterns of Demand, calculated using the Co-efficient of Variance (CoV).
Inventory consultant, Tom Rafferty has provided a methodology to calculate the patterns. To commence, the volume based ABC ranking of sales by SKU is extended to identify Categories from A to F, as shown in the diagram below.
Although the SKUs within each Category have similar sales volumes, they can exhibit a range of sales patterns, reflected by the standard deviation. The Co-efficient of Variance (CoV) is calculated by dividing the standard deviation of sales for an SKU by the mean of its sales. As shown in the diagram below, each CoV cut-off is identified by Class.
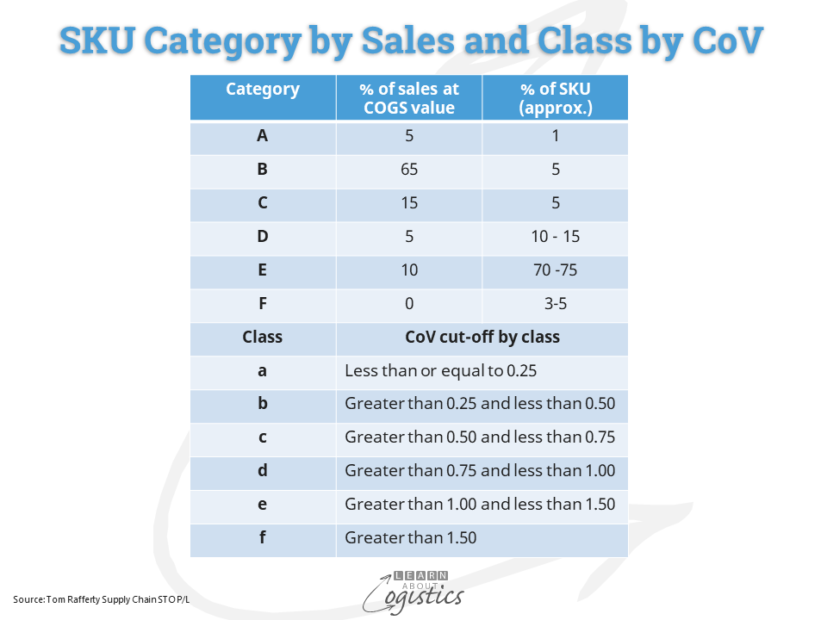

The diagram above shows the grouping of SKUs by Category and Class to provide the Pattern of Demand. The next step is to document how each pattern will be managed.
Steady: with a low variability of demand, actual sales should be close to the forecast. A high service level will not require a high safety stock. Inventory is managed with the ‘Tracking Signal’. This is calculated for an SKU by dividing the cumulative variation for the number of periods under review by the standard deviation. For Steady demand products, the acceptable tracking signal is about 4.0
Variable: forecast error for SKUs will be varied. Use a tracking signal of 7.0 as the trigger for a review. Use applicable customer service levels (or safety factors), for the safety stock requirements. This applies especially in category/class Ac and Bc.
Erratic: individual SKUs have substantial total sales, but period sales can vary dramatically, such as with seasonal products. Logistics needs to work with Sales to understand the causes of variability for these SKUs, which could be sold to only a small number of customers.
The final three patterns of demand comprise the slow and obsolete (SLOB) inventory that is often sitting in large quantities on warehouse shelves, gathering dust and costing money! A slow-moving SKU has not registered any sales for six of the preceding 12 months, therefore cannot be forecast using the standard methodology – use Poisson probability distribution for small infrequent demands.
Irregular: the number of SKUs in this group is similar to the total of the previous three groups, yet constitutes only about 10-15 percent of sales value. The SKUs are typically purchased by customers in small quantities on an irregular basis. The ‘ideal’ decision would be to eliminate these SKUs. However, the sales department’s justification is that ‘customers demand a full range of product’. Logistics professionals should consider different ways of obtaining and supplying these product lines e.g. contract manufacturing.
Lumpy: in the FMCG and CPG sectors, elimination of these SKUs is a major challenge for Logisticians. Eliminated SKUs are likely to be replaced with ‘new and exciting’ products within 18 months. Service parts also fit into this pattern of demand. These are for sale to customers as part of the company’s business – mainly in the automotive, defence, health and industrial equipment industries, or are used within a company’s own facilities as service parts for operational equipment e.g. a large mine site may hold over 30,000 service parts.
Dead: SKUs which have not sold in the past 12 months. If they are not ‘insurance’ service parts, the SKUs should be eliminated from the catalogue.
Calculate the ‘right’ inventories
At the review of outbound supply chains, use the first diagram as the foundation – the Patterns of Demand, the ‘Channels of Distribution’ (selected for the business by Marketing) and the applicable ‘Attributes of Availability’ from the business plan (providing Availability is the role of Logistics).
The required customer service level is used to calculate the safety stock required. The level of customer service is defined for each Class within a Category, but particular SKUs can be modified for selected customers. Apply a ‘safety factor’ (obtained from a ‘Positive Z chart’) as the multiplier to the calculated Standard Deviation for an SKU.
Logisticians must have a clear understanding of the service and cost implications when making (and explaining to senior management) service level decisions, such as the number of distribution centres (more requires additional safety stock) and whether to have 95 per cent or 98 per cent service level for a particular SKU.
The flow of outbound supply chains provide the patterns of demand that influence the range of potential inbound supply chains shown in the first diagram. For items that are directly imported, the varying lead time and potential delays require safety inventory to be calculated, which could substantially increase the amount of inbound inventory. The same applies for items that are purchased from domestic suppliers, but are reliant on imported parts or ingredients.
Knowing whether the business is willing to finance the calculated level of inventory is of value, as it becomes part of the business plan, based on the business model. Without it, Logisticians are open to the INSANE approach to inventory by the CEO.