
Category Management role
Part of your organisation’s supply chains are the supply markets from which materials and items are sourced. But markets are complex, so a Supply Markets Plan can provide comprehensive knowledge of the supply market(s).
A Supply Markets Plan helps when taking advantage of current and impending supply situations. Knowledge of your organisation’s relevant supply markets also enables Procurement specialists to better negotiate contracts with Tier 1 (Core) suppliers.
The Flow to a Supply Markets Plan diagram identifies two separate but linked activities: Strategic Sourcing and Category Management. These are not related to a direct purchasing activity – developing the Plan occurs before any action concerning specific purchases.
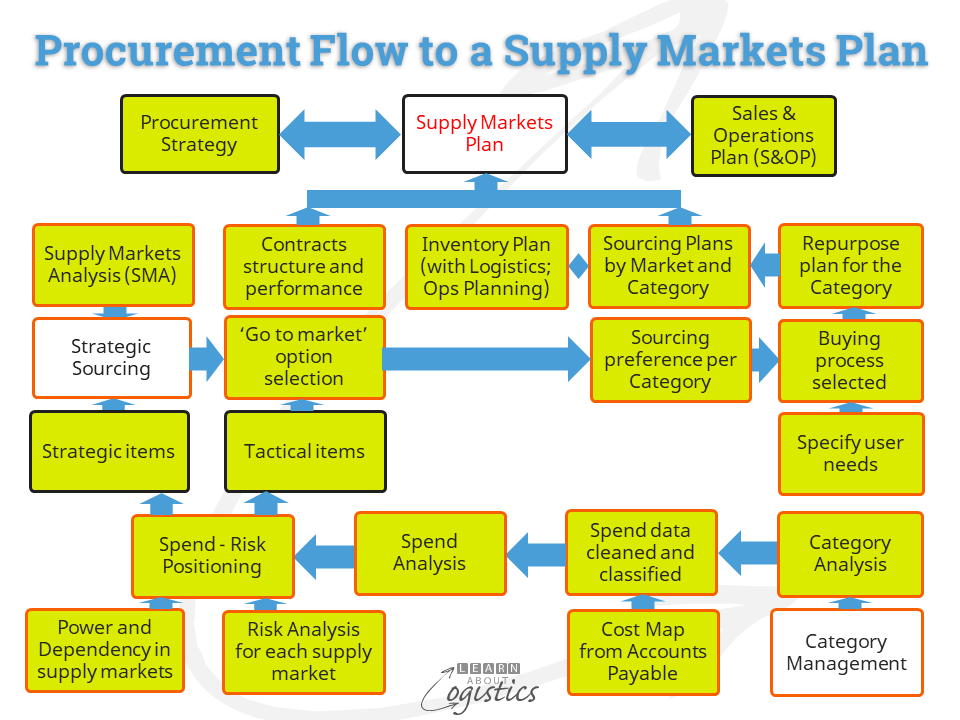
The previous blogpost discussed Supply Markets Analysis as a necessary input to Strategic Sourcing. The other inputs comes from Category Management, which provides a working structure for purchased items in your business. It incorporates:
- Category Analysis: the allocation of purchased items to categories and sub-categories;
- Spend Analysis: identifies the pattern of spend on purchased items, using input from the ‘Cost Map’ of expenditures;
- ‘Spend – Risk Positioning’: a matrix using data from the Cost Map and Risks for a category or sub-category in a supply market. Risk has two inputs:
- Risk Analysis for each category supply market
- Power and Dependency Analysis within a supply market
Category Management elements
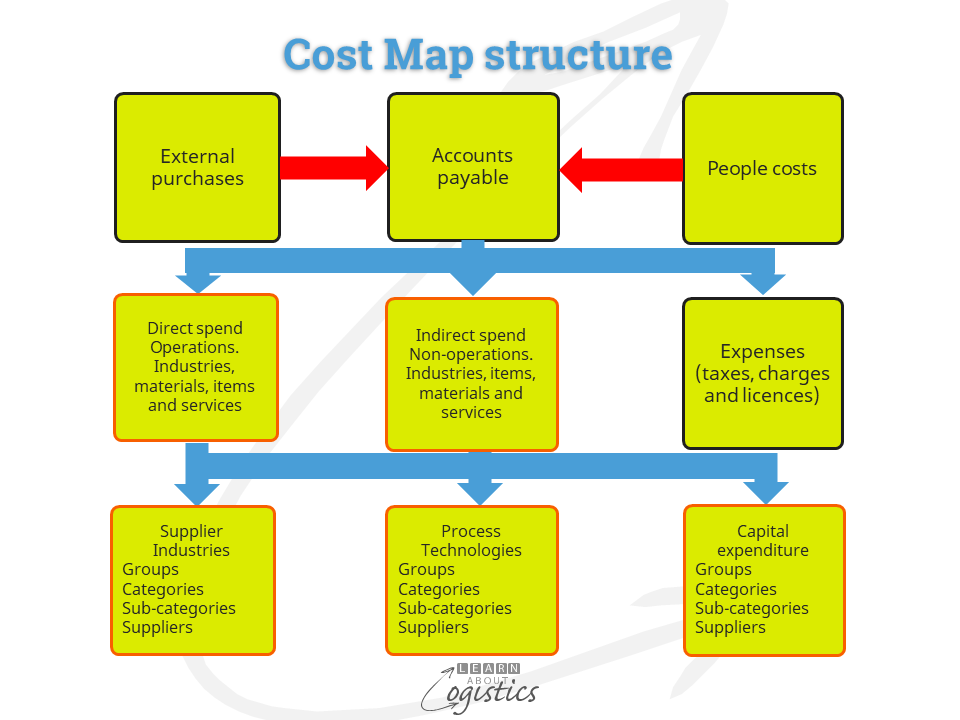
Category Analysis: The items purchased by an organisation are grouped within either ‘supply industries’ or ‘process technology’ to separate ‘direct’ and ‘indirect’ purchases. Examples within each group are:
- Supply industries groups: e.g. Metal type; Packaging type; Ingredient type. As an example:
- A supply industries group is named ‘Ingredient type’
- A Category within this group is named ‘Sweeteners’
- One of the Sub-categories is named ‘Glucose’
- Process technology groups e.g. IT and telecoms; Logistics services; Travel and entertainment; Marketing; Facilities. As an example:
- A process technology group is named ‘Facilities’
- A Category within this group is named ‘Industrial supplies’
- One of the sub-categories is named ‘Safety glasses’
The categories of spend will vary to suit the needs of each organisation. For example, a fluid transfer pumping system will be categorised differently in the health and food industries than in the waste water maintenance industry.
While your business can format its own codes, there are a few coding formats available; the best known is the United Nations standard products and services code (UNSPSC). The UNSPSC code structure is a four-level hierarchy with each level represented by two digits.
Spend Analysis identifies the pattern of spend on purchased items for an organisation’s supply categories and sub-categories to identify (for example):
- Spend in the previous period (year, quarter, month)
- Items with the highest spend over successive years
- Whether the organisation could exert buying leverage in a supply market
- Potential for spend reductions in a supply market
To answer these questions, Procurement must collect within one system purchasing data concerning transactions with external parties. The ‘Cost Map’ diagram illustrates the five groups of spend.
As corporate financial and accounting systems are not designed for use in Supply Chains, the transaction data for orders and payments in the accounting system must be reformatted. Given the scope, a software application is usually required to scan across multiple systems (head office and subsidiaries/divisions) and format the accounts payable transactions into the category structure.
A Spend Analysis IT application must contain the following components:
- Data capture – software to collect and consolidate spend data in purchase order (PO) and accounts payable (A/P), located in multiple IT systems, business units and geographies
- Data warehouse tools for manipulating the downloaded data at the repository
- Normalisation – cleaning the data to eliminate discrepancies within the downloaded data
- Classification – code items based on a uniform schema to ensure commonality for the same items. Could use the United Nations Standard Products and Services Code (UNSPSC) or other code structure
- Analysis and reporting tools to organise and consolidate data
Point 3 notes that after the data is retrieved, it must be cleaned (normalised) so that information is meaningful for analysis. Discrepancies that are important for Procurement to resolve are:
- Suppliers can trade under multiple divisions and businesses, although ultimately owned or controlled by one entity
- A supplier’s name can be entered differently in the buying organisation’s accounts payable files. For example, Ford Motor Company and Ford Australia
- Multiple general ledger and cost centre names
- Categories and standard industry (SIC) codes may be used in one part of the organisation, but not others
- Descriptions of the product or service can vary, depending on the user
Category Management risk
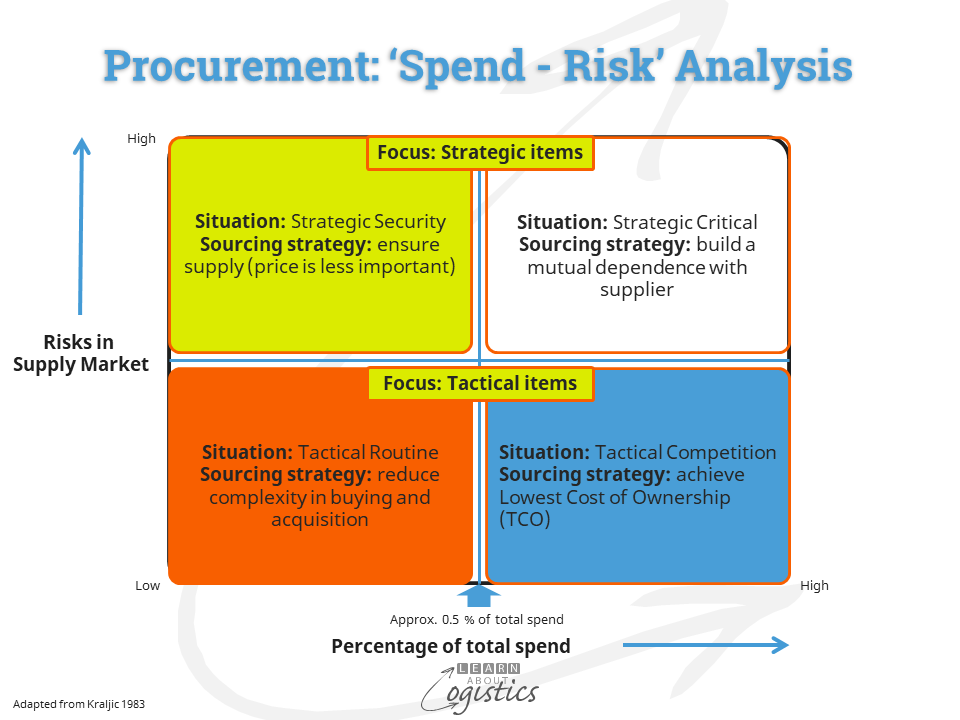
Spend-Risk matrix is to place markets or items or suppliers in a quadrant to reflect the approach by Procurement. The diagram illustrates the four quadrants (not necessarily of equal size shown in the diagram) divided by the level of spend and risk into strategic and tactical buys. This can be modified, depending on the sub-category being considered.
Risk Analysis associated with a category and sub-category in a supply market are identified under the headings of:
- External risks: interactions between a supply market and its wider environment – geopolitical, climate, financial etc.
- Supply Chains risks: within the inbound supply chains for a supply market
- Internal (enterprise) risks: related to potential uncertainties in executing the organisation’s Supply Chains strategy. For example, identify the potential financial and reputation impacts on the organisation if the buying process goes wrong e.g. suppliers at Tier 3 or 4 in a supply market employ child labour
- Supply chain process risks: inability to achieve consistent outcomes relating to planning the movement and storage of materials from a supply market
Power and Dependency Analysis occurs when a supplier exerts power over a customer or a buying organisation exerts power over a market or suppliers. An example is a customer unilaterally extending the payment terms. Suppliers in a competitive supply market must accept the revised payment terms, while those in a monopoly/duopoly and cartel type situation will be treated differently. For example, a supplier providing a cloud-based software application will be paid net 30 days (or sooner), because they can ‘switch off’ supply. Conversely, is the situation of Dependency of a business on a market, supply chain, customer or supplier. Both factors can influence the working of a supply market.
To assist with the challenges of implementing a Supply Markets Plan, your organisation’s Procurement professionals will need to talk the language of accountants and ‘sell’ the principles and process of Category Management as being in the self-interest of Finance.