
Variability in processes
Variability is always present as a natural part of any process and describes the random disruptions that may occur as a process or event is undertaken. In supply chains, Variability is the term associated with the difference between actual and planned lead times, which are not static.
Variability exists at all tiers of a supply chain: supply of materials and components, production through various machines and deliveries to customers. Variability is one of three factors that influence the level of Uncertainty in an organisation’s supply chains; the other two factors are Complexity and Constraints.
Understanding the causes and possible approaches to limiting variability in supply chain processes and events, is a part of a logistician’s role. Causes of variability are due to short term situations, such as:
- Transport capacity available and its reliability
- Planning and scheduling errors and data entry mistakes
- Inventory being out of stock
- Additional processes at cross-border customs
- External labour issues
- Weather events
Dependency occurs when a node or link in a supply chain is dependent on the ‘in full, on-time’ completion of events at the previous node or link. If the link in the supply chain is broken, it increases variability, which in turn increases Uncertainty,
As your organisation becomes more regional or global, these situations and consequential disruptions in your Supply Network increase, due to:
- Breadth: the number of tier 1 customers and suppliers
- Depth: the number of customer and supplier tiers in each supply chain
- Spread: the global geographical receipt and delivery location(s) of customers and suppliers through the Supply Network
Analysis of variation
Shewart was first to describe variation in processes in 1931. He made the distinction between ‘common causes’ and ‘special causes’ of variation. Common or system causes of variation are those that are common in occurrence and have random outcomes, which can be measured. About 85 per cent of the variations in a process come from common causes. The remaining 15 per cent of variations are the result of special or assignable causes; that is, the cause of the variation is from outside the design of the process. However, they are relatively easy to detect and assign.
The availability of sufficient data allows more predictive analytics. The objective is for a process to be in ‘statistical control’ or just ‘in control’, with results lying between the control lines of a control chart.
Control Charts allow managers to have a better understanding of how the processes are performing. For example, a logistician would be interested in the variability of delivery lead times for imported items. But, even better would be the variability of each link in that supply chain. For example, some of the imported items are delivered to a warehouse in a city about 10 hours’ driving time from the receiving port. However, the actual time taken could be nine hours with a good driver, but 12 hours if the traffic is heavy. How does the transport manager know whether the delivery process is in control?
Records of previous journeys provide the data to calculate the upper and lower limits for the control chart; calculated by the variation from the mean. Each subsequent journey time will be recorded on the control chart to show whether it is ‘in control’ (within the control lines).
A journey that is outside the control lines would be ‘out of control’ and subject to analysis and improvement. If journeys are consistently ‘in control’, the transport manager could authorise a recalculation of the control limits to bring them closer together.
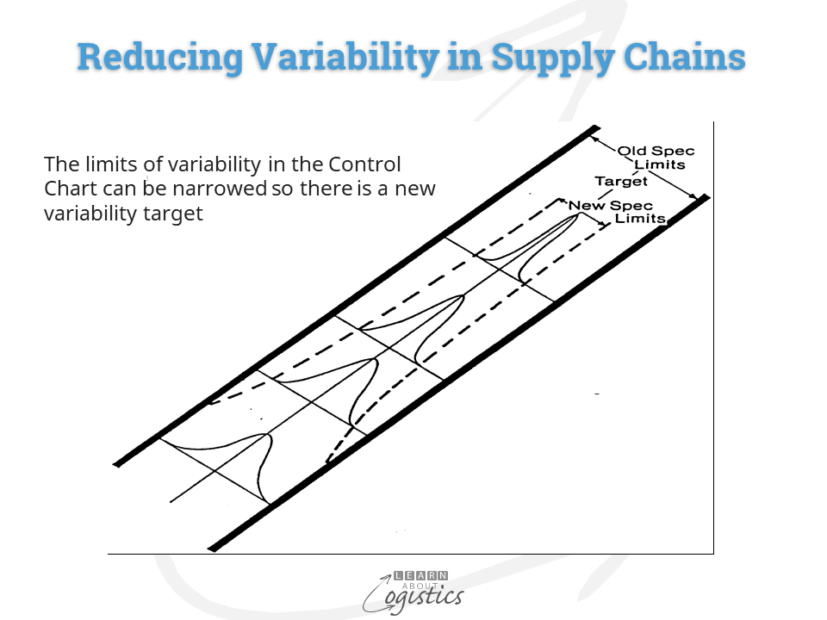
By plotting actual times on a control chart, the transport manager (and supply chain senior executive) will have an indication of what may happen in the future – the trend. It is much better to inform senior management of likely future situations and the reasons, supported by analysis to improve the process and so narrow the acceptable limits. This is proactive management through measurement.
Analysis of shipping transit data allows the comparison of: actual voyage time to the published schedule; actual voyage time to the average for the past ‘n’ months and how ‘tight’ is the range of variation of voyage times. In addition, by voyage will be the actual allocation of requested loading slots and whether all agreed containers were loaded.
This type of data provides the transaction inputs for a predictive lead time management software application that turns the data into ‘intelligent’ information. This becomes input to generate the most likely lead time for each item at a point in time.
Action in operations
In addition to using control charts, the process in operational areas e.g. production and warehouse, requires analysis to reduce variation An approach is the ‘5M’ elements of a process: materials, methods, machines, manpower and measurement; together with the environment i.e. working conditions, such as temperature and humidity. The tools, instruments and inspection requirements are elements in their own right and will have their own process. Each element is subject to variation,
In the example, the transport manager can work with the drivers to identify changes in the 5Ms that would bring even more consistency to the travel times. The analysis could identify changes to the system; for example, starting the trip later or earlier to miss heavy traffic; using a more aerodynamic semitrailer, or a more powerful prime mover so that time is not lost due to slowing down on hills.
The challenge for organisations (and their managers) without a system that measures the variability of processes is that managers can react inappropriately to events. They might assume a special cause when none exists, or that things went wrong when there was actually a common cause.
Measurement and analysis is the first requirement in understanding variability in your supply chains. The operational actions which can support the analysis are:
- Safety inventory to allow for variation in lead times and safety inventory to cover for the difference between the order interval and the delivery lead time
- Managing the allocation of finite capacity e.g. pulling forward demand to load factories; reduce non-productive capacity e.g. implement single minute exchange of dies (SMED) and manage the Overall Equipment Efficiency (OEE) through planned preventative maintenance
Uncertainty in supply chains can be better understood through analysis of the three contributory factors. It is only when this is an integral part of management can risk management be implemented.