
Supply Planning and relations with suppliers
Improving relationships with suppliers which provide critical items for your organisation, is critical to having more effective supply chains; whether Procurement is part of a supply chain group or not.
Supply Planning is illustrated in the diagram and is a structured approach to provide a foundation of how relationships can be developed and maintained. The objective is to provide added value to the Procurement Strategy. This identifies how Procurement will provide a commercial competitive advantage and maximise its contribution to corporate profitability. The Procurement Strategy, together with the Operations Planning and Logistics strategies, combine to form the Supply Chain strategy.
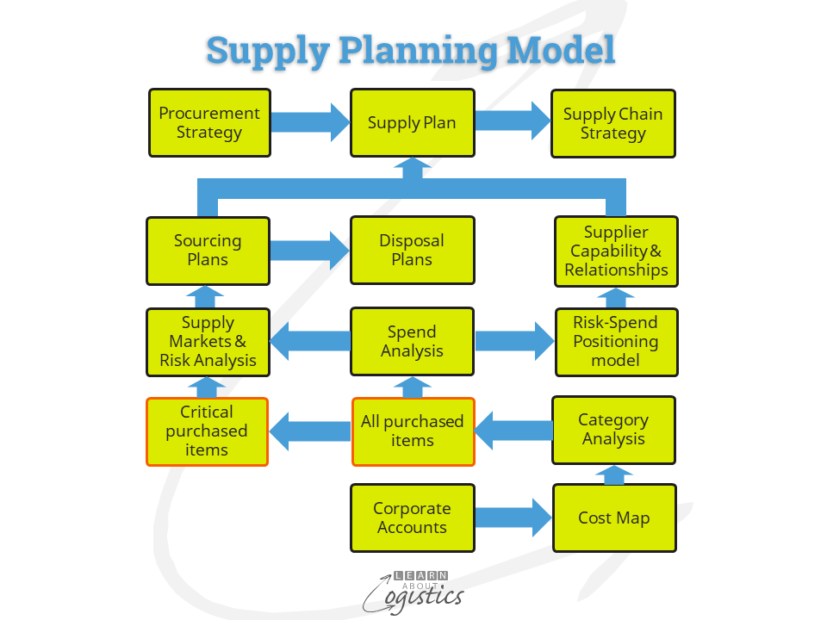
The model contains three groups of activities which provide inputs to the Supply Plan:
- Category Analysis with the ‘Cost Map’ as the main input (which relies on inputs from corporate accounts)
- Spend Analysis, which includes the ‘Risk-Spend Positioning’ matrix and the ‘Supplier’s view of the buyer organisation’. When linked, they provide the ‘Supplier Capability and Relationships’ matrix for and item or sub-category
- Sourcing Plans, which includes ‘Supply Markets and Risk Analysis’ and ‘Disposal Plans’
Each of the steps through the model help Procurement to analyse two questions:
- What and how much do we buy?
- From whom do we buy and why?
And the answers to these questions provide the basis for reviewing:
- How do we buy – the process?
- How well do we buy – performance measurement?
Through the analysis, Procurement will acquire a better understanding of the organisation’s supply chains and the parties engaged in providing items. This will include identifying:
- Vulnerabilities (risks), such as reliability of supply
- Volatility (potential waste) caused by variability of demand
- Initiatives to reduce risks and waste
- Measures of performance for risk and waste reduction
Spend Analysis – the pattern of purchasing spend
The outputs from a Spend Analysis will be:
- The organisation’s spend for each Procurement category, sub-category or selected item in the previous period (year, quarter, month)
- The highest spend items over successive years
- Whether the organisation can exert buying leverage within a supply category market
- The categories which show the best potential for spend reductions
The means to identify the outputs is the Risk–Spend Positioning matrix and the Suppliers view of a customer. Together, they provide the Capability and Relationship matrix.
Risk–Spend Positioning matrix
The diagram illustrates the range of approaches required towards a supplier in a supply market. The approach depends on the level of spend and the degree of risk in the buy. The base matrix provides four quadrants (not of the equal size shown in the diagram) which are divided by the level of risk into strategic items and tactical items. The base approaches can be modified, depending on the item or sub-category being considered.
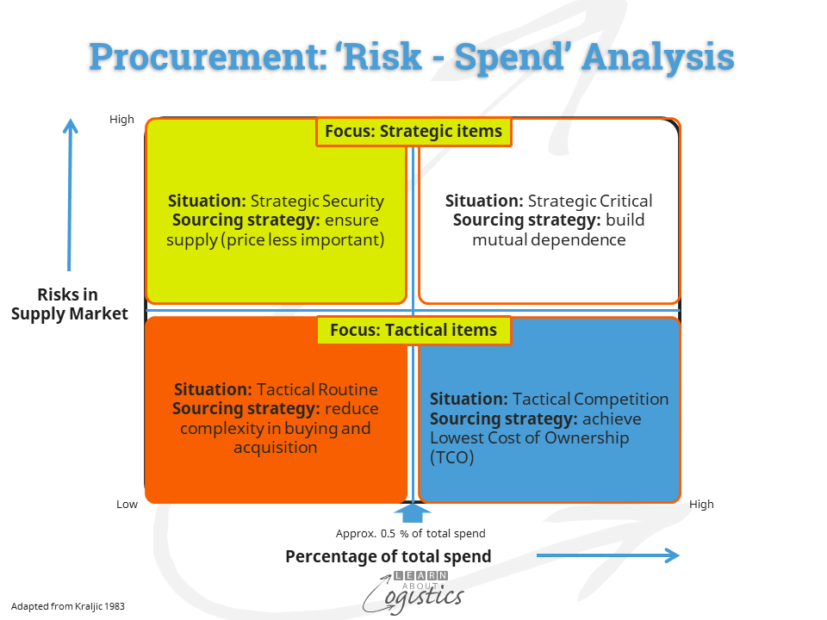
Quadrant 1 (red) – Tactical Routine: The amount spent on an item is a low percentage of the ‘total spend’ by Procurement and there are low risks in doing business. The sourcing strategy is to make buying a routine process. Simplify all processes so that minimal attention is required; for example: buying on-line, through e-auction and vendor managed inventory (VMI). Emphasise purchasing efficiency.Examples are office stationery and workshop small tools.
Quadrant 2 (blue) – Tactical Competition: Spending on the item or sub-category is higher than 0.5 percent of the ‘total spend’ by Procurement. The risks remain low. The sourcing strategy is to achieve the lowest Total Cost of Ownership (TCO). Encourage competition between suppliers to reduce costs. If the buyer has commodity expertise and knowledge of the market, include global sourcing. An example is glass items (i.e. windscreens) in vehicle assembly.
Quadrant 3 (green) – Strategic Security: The risks associated with the buy are high, yet the percentage spent is a low percentage of the ‘total spend’ by Procurement. There are limited alternatives for the item. The sourcing strategy is to recognise that security of supply is important. Develop a reliable relationship with the supplier. Remove bottlenecks in the supply chain and other impediments to doing business. A possible approach is to develop an early supplier involvement (ESI) program, to ensure that limited or restrictive supply market conditions are avoided or removed.
Quadrant 4 (white) – Strategic Critical: Involves items which are critical to success of the enterprise. Risks are high and the percentage of annual spend is also high. The sourcing strategy is to develop a long-term relationship, based on a mutual dependence and sharing of risks between the parties. Work closely with suppliers to improve the total performance of the relationship, managing power and dependency issues. Consider developing a strategic alliance.
The Risk – Spend Positioning matrix provides the buyer’s view of the sourcing situation. However, for it to be of value requires a second view – the supplier’s. The Supplier’s view of a customer matrix diagram illustrates the buyer’s impression of possible approaches by a supplier based on the:
- Percentage of total annual sales that are (and could be) obtained from the customer (the buyer) and gross margin and
- ‘Cost to Serve’ the customer
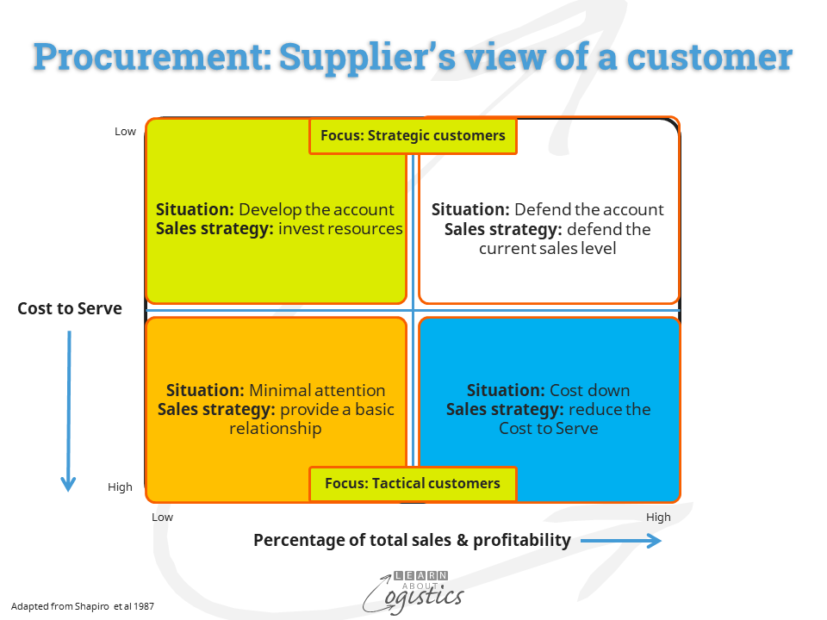
Quadrant 1 (Brown) Minimal attention: A low percentage of total sales, with a high cost to serve. The supplier’s decision will be to either maintain a minimal relationship or cease doing business with the customer or client.
Quadrant 2 (Blue) – Cost down: The percentage of annual sales is acceptable, but the ‘cost to serve’ is high. If the customer is willing, the supplier could work with them to reduce the ‘cost to serve’ and improve the supplier’s margin
Quadrant 3 (Green) – Develop the account: The percentage of sales is low, but the cost to serve is also low. There may be a potential for increased business. The supplier can invest resources to develop the account and build a case for additional sales.
Quadrant 4 (White) – Defend the account: With high sales and a low ‘cost to serve’, the business must be defended. Tactics by the supplier are:
- employ a dedicated account manager
- provide high levels of customer service
- initiate discussions concerning a strategic alliance
Match the analysis
With both the analysis, a procurement professional can identify suppliers with an approach that mirrors the buyer’s needs. Also, where there is a mismatch which requires attention.
For example, the analysis of office stationery shows it to be in the Tactical Routine quadrant. The ideal match will be a supplier which views the account as Defend the account (Quadrant 4 (white)). Here, the supplier is more likely to provide the level of customer service under a period contract, which allows the buyer to have the required ‘minimal attention’.
If the buyer considers that the supplier will view the account as Minimal Attention there will be problems, because neither the buyer nor supplier will put effort or resources into the contract.
This approach to building relationships with suppliers allows an organisation to develop a more sustained position in the supply market and reduce costs. This approach is not about reducing supplier prices (but is about reducing TCO) and therefore must be evaluated from a broader business perspective than simple cost savings.