
Optimize flows not the functions
To better understand the performance of their supply chains, organisations should measure the performance of Flows – items (going out and reverse); money; information and data, rather than emphasising the ‘efficiency’ of individual departments.
The core Flow of the Supply Chains group (Procurement, Operations Planning and Logistics) is to provide Availability that satisfies customers’ needs for an organisation’s products and services. To achieve Availability requires the time-related positioning of internal and external resources to provide goods and services for customers at the lowest total cost. This is across two areas:
- Physical Availability (place, time and quantity of items)
- Operational and Infrastructure Availability (operational support; maintainability and supportability of products, facilities and equipment)
To know what level of Availability is possible requires a measure of the capability to satisfy customers’ needs. This measure is the capability to deliver products and associated services ‘In Full, On Time with Accuracy’ (DIFOTA). The diagram illustrates the flow of data to calculate the DIFOTA probability for a business.
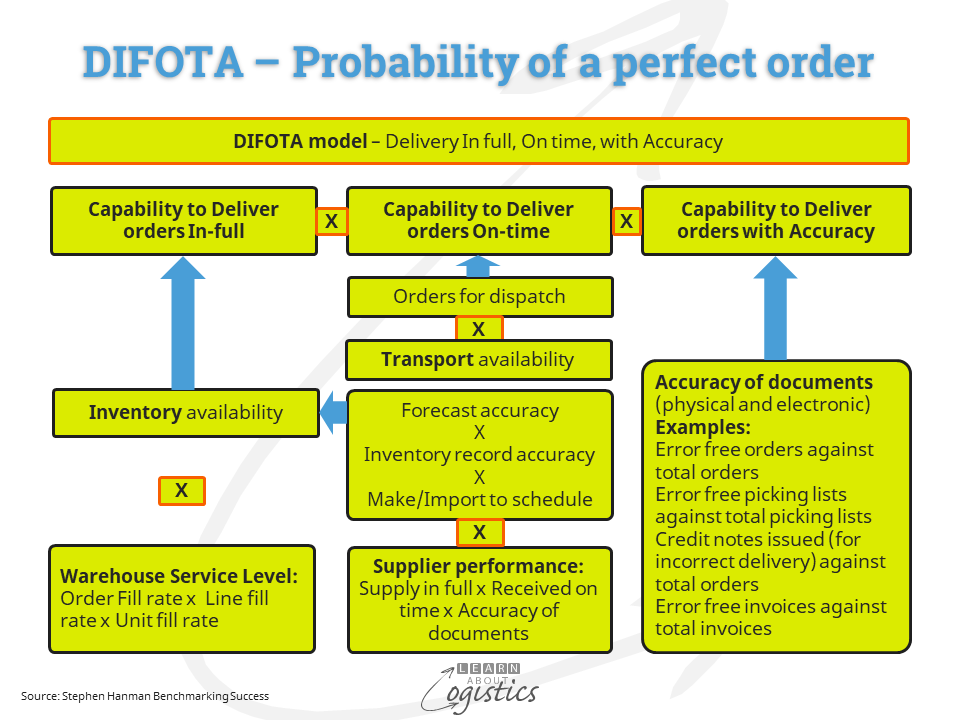
DIFOTA is a measure of effectiveness
DIFOTA is not a measure of efficiency. It is a measure of how effective the organisation is, through calculating the probability of achieving a ‘perfect order’ – that is, in full, on time, with accuracy. A ‘perfect order’ means that:
- the initial customer order has not been modified because:
- sufficient inventory is not available
- particular items (SKUs) are not available or
- unable to make delivery when required by the customer
- the order is delivered ‘in full’
- the customer receipts the order ‘on time’ and
- all documents associate with the order (electronic or physical) are accurate
The aim for an overall DIFOTA measure should be greater than 91 percent. In the quest to achieve ‘perfect orders’, the individual measures should aim for:
- Delivery in full = 99 percent, with inventory availability at 95+ percent
- Receipt on time = 99 percent
- Accuracy of documents = 99 percent (order entry at 99 percent and invoice accuracy at 99 percent
Calculating the DIFOTA model
The DIFOTA probability is calculated through multiplying the three performance measures (in full, on time and accuracy). While DIFOTA is calculated on a monthly basis, the more important outcome is tracking the trend. An example calculation is:
Delivery – In Full
- Inventory availability: The product lines, or SKUs that are available now to fulfil the customer order, divided by the total lines ordered = (say) 80 percent
- Inventory availability is calculated by multiplying together the four factors of: forecast accuracy, inventory record accuracy, make or import to the schedule and supplier performance
- Supplier performance is the DIFOTA measure for each supplier
- Warehouse service level: If the order is for 10 SKUs totalling 100 units, but 9 SKUs totalling 95 units are dispatched, the Service level is 85.5 percent. This is calculated from the product line fill at 90 percent; the unit fill at 95 percent and the order fill at zero percent.
In Full performance is therefore: 80 percent x 85.5 percent = 68.4 percent
Receipt – On Time
- There have been 100 orders, with 90 delivered on time = 90 percent
- Transport availability:100 hours of truck time required (own fleet or 3PL), but 90 hours available = 90 percent
On Time performance: 90 percent x 90 percent = 81 percent
Accuracy of documents
- Order entry: The number of error-free orders divided by the total number of customer orders = 97 percent
- Customer claims: The number of credit notes issued to customers (due to wrong delivery address, wrong quantities, wrong delivery time etc.), divided by the total number of orders = 97 percent
- Invoice accuracy: The number of error-free invoices divided by the total number of invoices = 98 percent
Accuracy of documents performance: 97percent x 97 percent x 98 percent = 92.2 percent
The resulting DIFOTA measure for the month is: In full at 68.4 percent x On time at 81 percent x Accuracy at 92.2 percent = total DIFOTA probability of 51 percent. This could be a typical measure for a business in the consumer-packaged goods (CPG) and fast-moving consumer goods (FMCG) sectors.
Even if each of the three measures is calculated for one month at 95 percent, then by multiplying the three, the DIFOTA probability measure is 86 percent. This translates to approximately one in seven customer orders that has a likelihood of encountering a problem somewhere in the process flow.
So, each step in the process of handling a customer order has an effect on the overall DIFOTA probability measure, because each of the measures that affect the DIFOTA probability are linked. Improvements should therefore be addressed within an overall Supply Chains Flow approach, rather than the more typical piecemeal ‘department efficiency’ approach that is used in many businesses.
Implementing DIFOTA
Unfortunately, software application providers have yet to recognise the benefits to their clients of providing a comprehensive set of effectiveness measurements for supply chains and the functions of Procurement, Operations Planning and Logistics.
As the data required for each of the elements in the DIFOTA probability model is most likely available from with an ERP type system, a business intelligence (BI) query facility can be used to extract the required data and structure a model for the measurement of DIFOTA.
Although supply chains contain elements that require a measure of efficiency, the real benefit is to measure how effective is the Supply Chains group. An effective group is better able to gain an understanding of the likely future challenges for the business and to respond to changes in the complex adaptable system that is their supply chains network.
Improving the DIFOTA probability measure means that your business is more likely to provide superior customer service than competitors. Because service (and services) is more difficult for competitors to copy, a high DIFOTA provides a competitive advantage.