
Disruptions in supply chains
Is there a need to know about your organisation’s Extended Supply Chains – upstream and downstream from the Tier 1 suppliers and customers? The answer is Yes.
Disruptions in supply chains can often be caused by situations at Tiers 3 and 4 suppliers and logistics services. Current environment based examples are: a lack of water in the Panama Canal system that restricts the number of ships through the locks; drought in Spain restricts the supply of vegetables to the UK and record temperatures in Thailand requires people (including workers at export factories) to stay at home. For multinational companies, the additional reason is Sustainability regulations, which require reports about a company’s total supply chains – Core plus Extended.
The supply data analysis firm Resilinc reported that some of the worst supply disruptions through 2022 occurred because manufacturers became short of common low-cost items or raw materials. Examples were: neon, coolant, paper, cotton, glass, and copper – all produced at the lower Tiers of supply .
A Supply Markets Design Map requires input about the Core and Extended supply chains. The Core, between the business and its Tier 1 suppliers customers was discussed in the previous blogpost. This blogpost discusses the Extended supply chains.
Flow to the Supply Markets Plan
The diagram below illustrates the process for Procurement to build the Supply Markets Plan and provide input to the Supply Chains Design Map. This process commences with Category Management (Category Analysis, Spend Analysis, Spend-Risk positioning); then Supply Market Intelligence (SMI) analysis and finally Sourcing Plans.
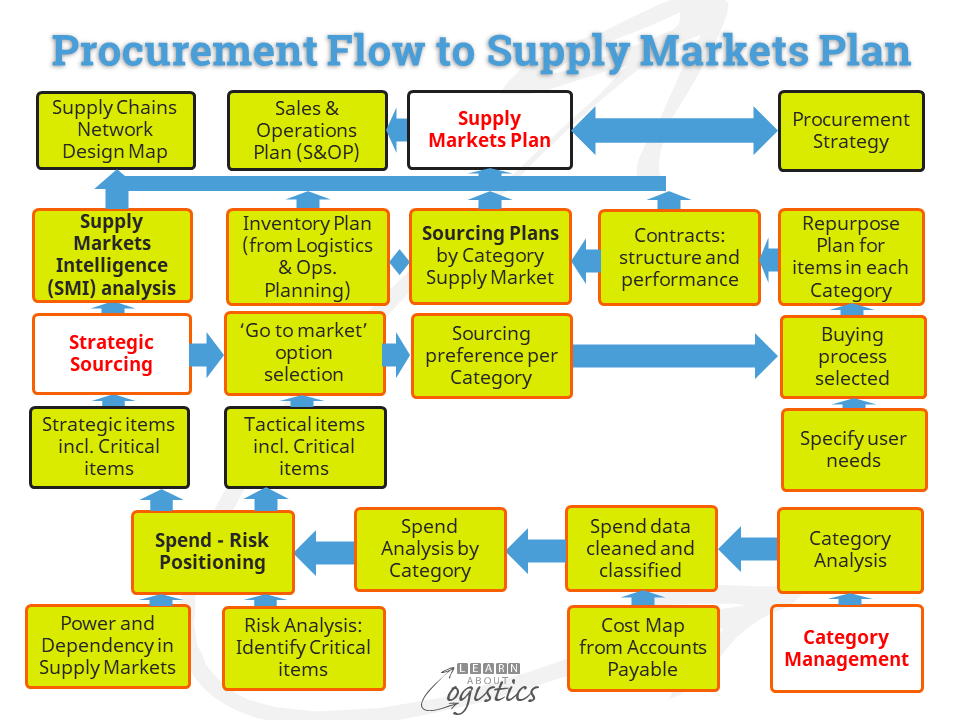
Category Analysis: items purchased by an organisation are separated into either ‘Supply industries groups’ or ‘Process technology groups’. Within each group, the items are identified by Category and sub-Category:
Supply industries group e.g. Metals; Packaging; Ingredients. As an example:
- A supply industry group is named ‘Ingredients’
- A Category within this group is named ‘Sweeteners’
- A sub-Category is named ‘Glucose’
Process technology group e.g. IT and telecoms; Logistics services; Travel and entertainment; Marketing; Facilities. As an example:
- A process technology group is named ‘Facilities’
- A Category within this group is named ‘Industrial supplies’
- A sub-Category is named ‘Safety glasses’
The Categories and sub-Categories will vary according to the needs of each organisation. For example, a fluid transfer pump system will be categorised differently in the health and food industries than in the waste water maintenance industry.
Spend Analysis: Your company may assume that it has reduced its supply risk by acquiring the same type of item from several Tier 1 suppliers, but from where do the Tier 1 suppliers obtain their inputs? And so on through the Tiers of suppliers. It could be that all supplied items within a sub-Category are reliant on one or a few suppliers at Tier 3 or 4.
Resilinc has identified that in pharmaceuticals, the pain reduction treatment called Paracetamol has several country based suppliers producing Active Pharmaceutical Ingredients (API). However, all these producers are dependent on an input product called para-aminophenol, that is produced in China. There are also similar situations of restricted supply with specialty alloys for instruments, special purpose adhesives and the coatings and substrates used in packaging.
Criticality measure: can be produced at different levels: national (supply group; category), industry (supply group; category) or company (category; sub-category).
How critical is a Category or sub-Category to your business? Annual spend with a supplier is not a valid measure – spend does not equate to risks. To identify critical supply items commences with Spend-Risk Positioning. As shown in the diagram below, this uses percentage of the total spend for each item and allocates them to segments based on risks in the supply market.
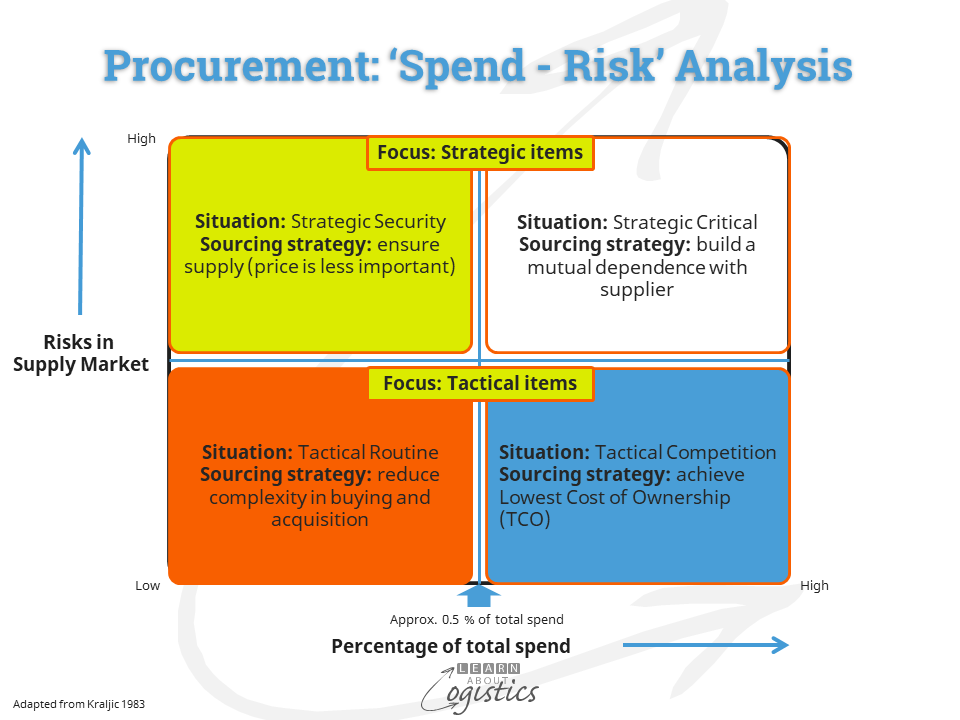
The items identified as Strategic are then analysed for Criticality, under six headings with examples:
- Dependency: if less than three countries can supply a Category or sub-Category, or if more than 50 percent of supply for an item comes from any one country and that country controls more than 30 percent of the global market for that item. Although there may be dependency for a Category or sub-Category on a supplier country, the risks associated with that dependency may not be high, therefore the Dependency score is low.
- Concentration of suppliers below Tier 1: reliant on a few suppliers or there are sufficient suppliers, but they are located in the same geographic area.
- Availability of supply: Geopolitical risks are high for the supplying country e.g. political stability of the supplying country; trade barriers may be erected e.g. political embargoes
- Vulnerability of supply: Material listed as ‘conflict material’; operational location and long-term supply certainty; price fluctuation extremes
- Trade impediments: business regulations adherence in the supplying country; trade regulation effects e.g. duties, anti-dumping tariffs; country regulation effects e.g. building permits for supplier
- Economic importance: importance of the Category or sub-Category in the development of future products; alternate sources of supply available from international or domestic sources; likelihood of new production technologies; substitution for the Category or sub-Category
Against each of the six headings, a score is entered that identifies whether your business is open to disruption from this heading. The total score is the Criticality ranking for that Category or sub-Category.
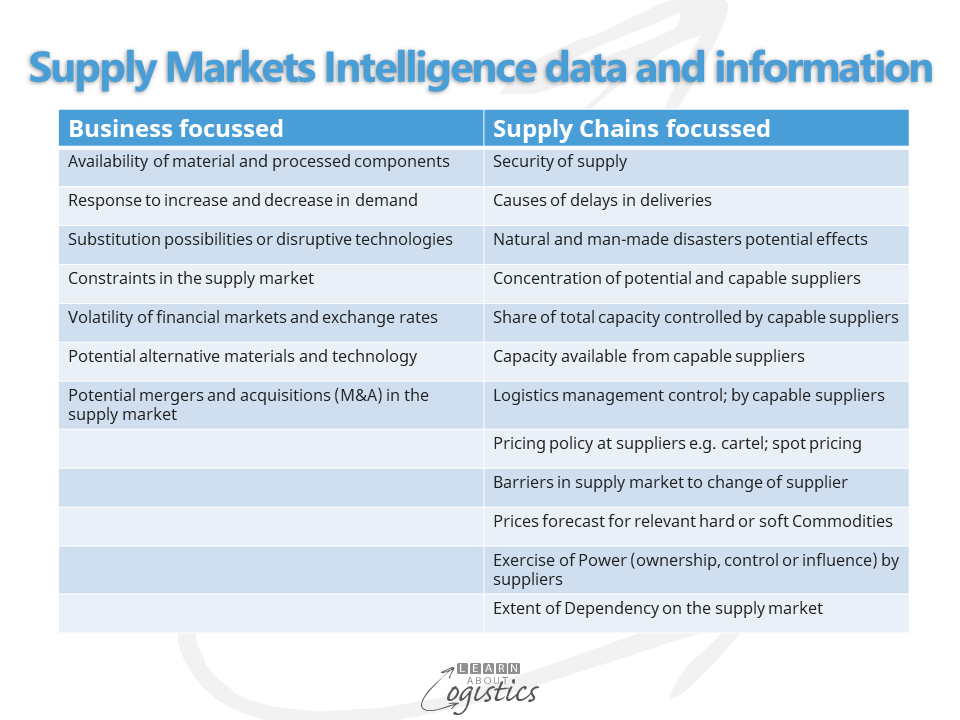
Supply Markets Intelligence (SMI) is the process of gathering data about the capability of each Category or sub-Category supply markets that are deemed to be critical to the business. The table below provides examples of question that could be asked in the SMI process. Templates and worksheets are available on-line which, although designed for sales markets, but can be modified to address supply markets.
The value of information comes from the quality of its source. Government statistics in developed countries is ranked high. Media and Internet based data is variable in quality and must be validated; while data provided by a ‘friend’ over lunch may be even less reliable (but should not be ignored).
Environment, Social and Governance (ESG) risks are identified within the SMI process. These are the external risks that arise from ESG interactions with supply markets at the locations (inventory nodes) and transport links through each supply chain.
Supply Markets Analysis: The benefit from collecting data and information is gained when it is analysed and the data entered in a structured format. Tools to assist the analysis are:
Review a country or multiple countries: P.E.S.T.E.L. with headings for the analysis: Political, Economic, Social, Technological, Environmental and Legal.
Review a supply market: Five Forces analysis (developed by Prof. Michael Porter) was designed for industry analysis, but the principles can be applied to supply markets, The five forces affecting a Category or sub-Category supply market are:
- Supply market competitors – extent of rivalry among existing suppliers
- Potential entrants – threats and opportunities from new suppliers
- Threat of substitute products or services and/or disrupting technologies
- Negotiating power of key suppliers and their power to influence the supply market
- Negotiating power of major buyers and their power to influence the supply market
Gains from the Map
Modelling: In the ‘Comments’ section of this site, David Cobby has noted that, building models of your company’s Supply Chains Design Map can be beneficial to understand the risks and alternatives. He quotes a dairy products business that undertook Modelling of their Map and increased the effective shelf life of some products by 20 percent, through identifying minor modifications to key parts of their supply chains.
The Supply Chains Design Map incorporates the Core and Extended supply chains and identifies potential supply market risks. The completed Map enables Category Managers to approach Tier 1 supplier(s) with confidence to discuss the risks associated with suppliers to the Tier 1 supplier.
The process to build the Map appears to be time consuming and therefore expensive to complete. But what is the cost of a surprise disruption that halts your business? Resilinc recommends the measure ‘Revenue at Risk’. Given the many scenarios of global instability, understanding and quantifying the risks through your organisation’s total supply chains is essential.