Setting inventory policy.
A Supply Chain manager will view performance across three aspects at the inventory policy level: customer service levels by inventory category/class; inventory turnover rate and the resulting operating profit. If this is done, inventory will not have to be managed against a financial target established in the annual budget. Instead, the inventory plan will be based on customer service policies, developed from the extended ABC analysis discussed in my recent blog.
Following the extended ABC analysis, the next step in your inventory management plan is to establish the safety stock required. This is calculated on two criteria. First is the level of customer service required within each category/class in the extended ABC analysis. The second is safety stock to cover differences in delivery lead time as supply chains become longer.
Customer service levels are based on understanding and responding to variability in supply chains. Variability is one of the critical challenges for Logisticians; the others being: uncertainty, complexity and constraints. Reducing variability reduces the amount of safety inventory that must be carried.
Calculating safety inventory
Results at the inventory policy level provide the parameters for inventory planning. Step one is to calculate the amount of safety inventory for each SKU, depending on the level of customer service that is defined for each inventory class within a category. Inventory category and class were discussed in my recent blog.
The role required for Logistics is to provide availability of products and services. But, one of the inputs to availability is the sales forecast. Over time, sales forecasts will either be more or less than actual. Safety inventory covers those ‘just in case’ moments when markets demand more than what was expected in the forecast. The challenge is, how much safety inventory to hold, because if a little extra inventory makes life easier, a lot of extra inventory will make life even easier! However, fifty percent of the time safety inventory is not required because forecasts are more than actual sales; so inventory is expensive to hold.
Forecasts of future events will never be ‘correct’ (except by chance), therefore measuring forecast error (or variance) does not signify a mistake, but a statistical calculation of the difference between planned and actual situations. To calculate the amount of safety inventory, the safety factor for each level of customer service can be identified. This is applied against the standard deviation of past variances between forecasts and actuals. As the variance increases, so does the standard deviation.
To achieve 84 percent customer service, one standard deviation volume of safety inventory is required to cover the 2 of every 10 ordering occasions when it is likely there will be insufficient inventory to meet the sales demand. One standard deviation can be applied when the risk of a stock-out is low. SKUs in the A category are an example, because their sales and production flow are more consistent, with lower variances. The table shows the safety factors as a multiple of the standard deviation.
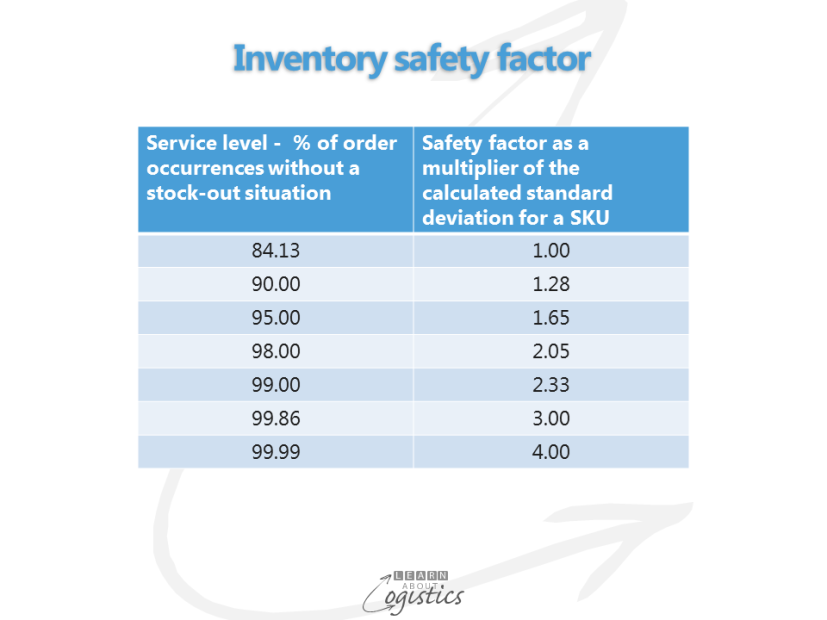
A service level of 99.99 percent requires four standard deviations. This gets you close to guaranteed customer service, but at a very high cost in inventory. For this reason, Logisticians must have a good understanding of service and cost implications when making service level decisions for a SKU.
In addition to safety inventory that accounts for variances in sales, safety inventory is also required for SKUs and their materials, to account for variability in lead times.
The first lead time variability calculation is where the lead time to receive the item is more than the time interval between placing orders. In that time period there is a likelihood that actual demand will differ from forecast. Then add to this the safety inventory calculated for the variation between planned and actual times in receiving items.
For an imported SKU in the VARIABLE category (see previous blog for the definition) that has a 98 percent customer service level, the lead time safety inventory could be more than the safety inventory to cover sales variances. The total safety inventory figures makes it even more important for knowledge to be applied in reducing variability in the Supply Network.
Measure inventory performance
Given an effective inventory plan is implemented, the measure of inventory performance is the Inventory Turn Rate (ITR) – the higher the ITR, the more effectively inventory is being used. The ITR is measured as: COGS for a time period that is annualised, divided by the inventory investment at the end of the time period. This measure is used at the inventory policy level, where product family and inventory category measures can be converted to financial measures and ratios for budget purposes.
Inventory management, comprising policy, planning and performance should be the responsibility of the Supply Chain functions – Procurement, Materials Conversion and Logistics. Well planned and managed inventory balances demand and supply and improves the flows of items, money and information through the Supply Chains.