Building the inventory profile.
Structuring inventory provides the means to establish an inventory policy for your organisation – based on facts, rather than opinions. The inventory policy is the basis for calculating the amount of inventory the organisation needs to service its customers.
An inventory policy allows the CEO and accountant to work with a calculated level of inventory, so there is less room for SWAGS (scientific wild ass guesses). But how to do the structuring and calculating? Last week’s Blog discussed steps to structure an organisation’s inventory. This is done by extending the ABC categories and calculating the co-efficient of variation (CoV) by SKU, for at least the past 52 weeks of sales.
It was illustrated with a diagram showing a 20 cell matrix of active inventory groups, defined by inventory category and CoV class. The diagram below, developed by Tom Rafferty of Supply Chain STO Pty. Ltd. (tom@stogroup.com.au), identifies the Profile for each group of cells.
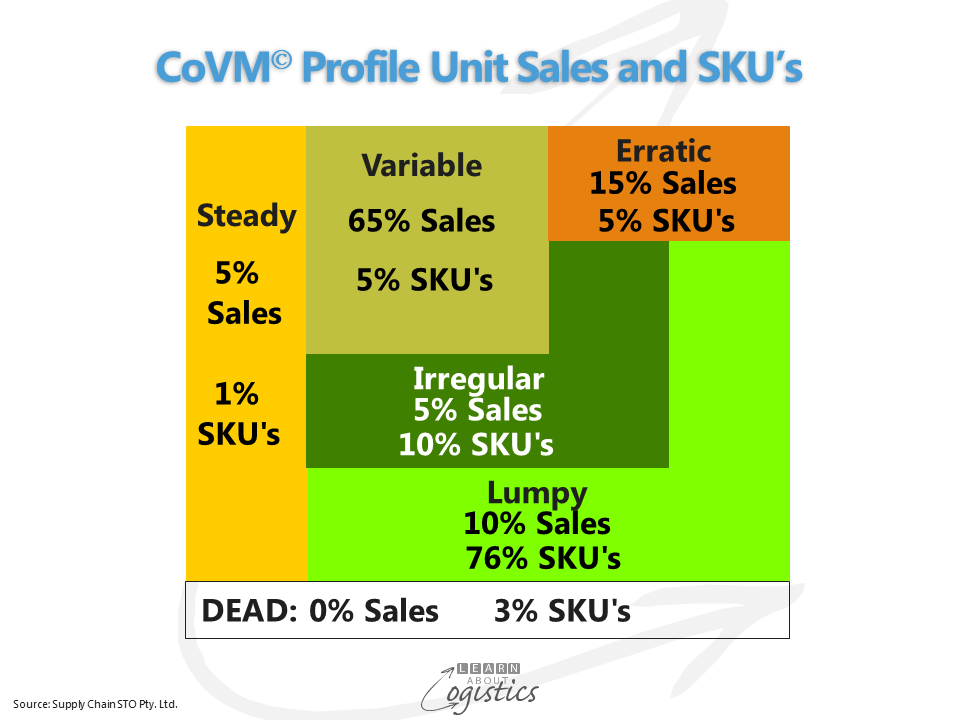
For ease of remembering, each of the six inventory groups has been given a descriptor; plus an approximate percentage of SKUs and the equivalent percentage of sales. These percentages are not ‘chipped in stone’, but provide a reasonable indication. (and a good starting point). By placing the SKUs into their calculated cells in the matrix, it is evident that different management approaches are required for each class, based on the pattern of demand.
STEADY: the SKUs which are placed in ‘class a’, where demand is steady with little variation, regardless of the volume sold or used
VARIABLE: due a variable sales pattern, the calculated forecast error of the SKUs in this group requires watching
ERRATIC: contains individual SKU items that have substantial sales, but sales volumes can vary dramatically. This is a challenge for logistics professionals, because the timing of a large sale may not be communicated
IRREGULAR: usually purchased by customers in small quantities on an irregular basis. The number of SKUs in this group is similar to the total of the previous three groups, yet constitutes only about 10 per cent of sales
LUMPY: can contain up to 70 per cent of all the SKUs, yet only about 5 per cent of the sales value – rarely ever more than 7 per cent
DEAD: those SKUs without any sales in the past 12 months
A CoVM example
The Table shows an organisation with seven products in the A category (15 – 20 percent of SKUs providing 70 – 80 percent of sales). For ‘category A’ SKUs, the typical (and wrong) approach is that category A is priority; never to be out of stock, therefore carry lots of safety inventory. The annual unit sales for each product are broadly similar and using the traditional ABC analysis, each of the SKUs would be managed in a similar manner.
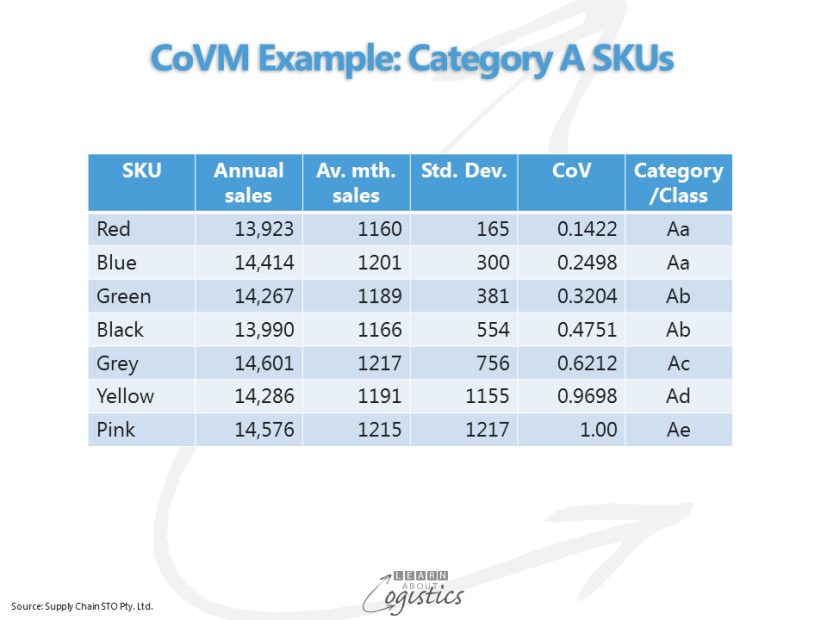
The Table illustrates the CoVM approach. By calculating the CoV for each SKU, the variability of demand (CoV) between products is evident, therefore a different management plan for each SKU group is required:
STEADY: SKUs Red and Blue are in the Aa cell. Forecasts will be close to actual sales, with a low variability of demand (and hopefully, supply). If the items are ‘make to stock’ (MTS), a high service level will not require a high safety stock. Inventory is managed through using the Tracking signal. This is calculated for each SKU by dividing the cumulative variation for the number of periods under review by the standard deviation. A control limit is established by class; for items in the STEADY class, the acceptable tracking signal will be about 4.0 (cumulative variance for the period/standard deviation of the period variance); below that, the forecast for a SKU is in control.
VARIABLE: SKUs Green and Black are in the Ab cell; SKU Grey is in the Ac cell. The trigger for a review of forecasts for an SKU will be a tracking signal of more than 7.0. Identify the required customer service levels or safety factors (data for the safety stock calculation), between category/class Ab and Bb and category/class Ac and Bc.
ERRATIC: SKU Yellow is in the Ad cell and SKU Pink is in the Ae cell. To manage this group, Logistics must work with Sales to understand the causes of variability for SKUs. Often, the sale of these products is to a small number of customers, so together with the sales representative, visit the customer and find out about their business and discover why their buying pattern is erratic.
Inventory management is also required for descriptors of demand that apply for categories B, C, D and E. These include the slow and obsolete (SLOB) stock that is sitting in large quantities on warehouse shelves, gathering dust and costing money! A slow-moving item is defined as an SKU that has not registered any sales for six of the preceding 12 months. All SKUs in these groups may be achieving between two and four stock turns per year.
IRREGULAR: the sales department could state that ‘customers demand a full range of product’. Logistics should therefore consider different ways of supplying the product lines. Outsourcing production to a smaller company may be a solution. If the item is imported, often with minimum order quantities, the product’s gross margin and customer service level should be reviewed, to ensure the item is viable within the sales catalogue.
LUMPY: in the FMCG and CPG sectors, eliminating this group of products is a major challenge. Consignment stock (also called Vendor Managed inventory (VMI)) is an approach. A product elimination process must be an integral part of the inventory management process.
DEAD: If the SKUs are not ‘insurance’ service parts, they should be eliminated from the catalogue.
The next step in the management plan is to review the level of customer service within each category/class; this is used in the calculation of safety stock. With global supply chains, variability in delivery becomes important and so does safety stock to cover variation in delivery lead time.