
More disruptions for supply chains
The longer hostilities continue in Ukraine, the greater scope for adverse interactions in the global system of commodity markets and supply chains:
- Direct economic effects on Russia and Ukraine, plus self-sanctioning by American and European companies with operations in Russia, including banks, insurance and shipping
- Effects in developed countries e.g. IT materials supplies; supply of metals – London Metals Exchange (LME) recent suspension of trading in nickel
- Damage to the economies of developing countries e.g. supply of grains from Russia and Ukraine for North Africa and Middle East
- Functioning of the multilateral system e.g. exclusion of Russia from the SWIFT banking transfers system
The ‘known-unknowns’ and ‘unknown-unknowns’ risks to supply chains contained in this list and from climate change events, will add to the current supply chain uncertainty caused by COVID. This uncertainty is then compounded in your organisation’s Supply Chains Network by continuing challenges:
- Complexity: built into processes, which are both internal (often management directed) and external
- Variability: in the patterns of demand and supply
- Constraints: in the Flows of items, money, transactions and information moving through an organisation’s supply chains
Risk analysis provides a structure for evaluating uncertainty. An oft-quoted saying is “without data you are just another person with an opinion” and that applies to businesses with limited data and information about their Supply Chains Network.
Supply Chains Network Design map
As shown in the diagram below, your organisation’s Supply Chains Network Strategy Plan is informed, then enabled by knowledge of the supply chains. This ‘knowledge bank’ is contained in the Supply Chains Network Design map of your current supply chains, from customer’s customers back to the farms and mines where the materials commence. The examples noted in the previous blogpost, showed that critical materials can be hidden from view in Tier 3 and 4 suppliers.
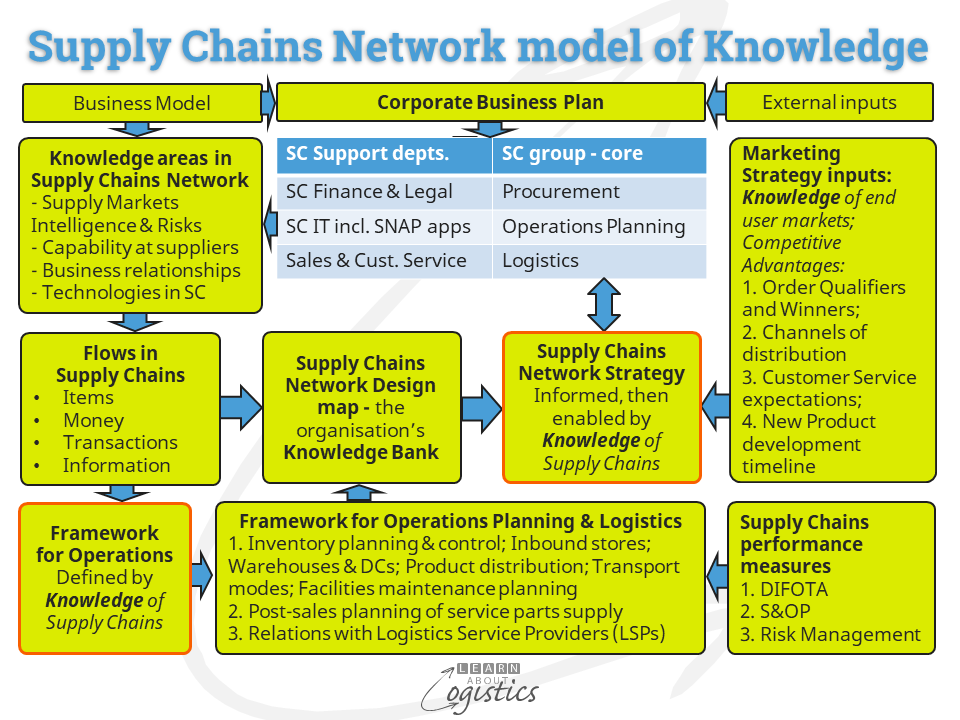
The challenge for supply chain professionals is to understand how their demand and supply chains currently work, the associated risks and potential for disruptions. The Supply Chains Network Design map is developed from flows – the transfer of materials/items, money, transaction data and information, through each supply chain operating as a ‘non-linear and complex’ system. This approach to mapping recognises that all aspects of the Network are connected
Flows may contain multiple time periods, or ‘buckets’, so that seasonality and inventory pre-build can be identified. Because output governs what a business can sell, Product Platforms are used for groups of products, based on the capacity and capabilities of constraint resources within operations. Capacity is expressed as a standard unit of measure linked to the constraint resource e.g. tonnes, shippers, litres, hours, pallets, loads etc.
Transfers are through Links between physical Nodes of the Network:
- Nodes – each location in the Network which holds material items, money, data or information. Provide suppliers’ and customers’ manufacturing and warehouse/distribution centre locations (including outsourced); capability (including capacity and responsiveness) and costs (even if estimated) at core (Tier 1) and extended (Tier 2 and below). Identify transport Nodes, such as sea and airports, transport hubs and intermodal terminals, with load capacity constraints and container/pack size limitations
- Variables – identify factors that can change the physical or financial values of items and money at a Node
- Links – transport movements by mode of materials and items between Nodes. Identify customer demand patterns through each outbound Supply Chain; lead times; cross-border requirements; potential bottlenecks and wait times at country borders and organisations (especially LSPs) that own, control or influence critical Links.
- the expected Time to Recover (TTR) if critical supplier nodes or transport links become unavailable
The Map is influenced by input concerning the ‘competitive edge’ of the business and input from Marketing that identify: Order Qualifiers and Winners; Customer Service expectations and the development timeline for new products. The Map can also be affected by changes to the business:
- Mergers and Acquisitions (M&A) may increase the complexity of supply chains, often without the provision of increased resources
- Expand the business to sell products in additional countries
- Substantial change to demands within countries and regions
- Changes to regulations that affect supply chains
Building a Supply Chains Network Design map is a substantial task, progressively built as information and data become available. For example, the corporate system will contain transaction details concerning a Tier 1 supplier, but it is unlikely to store the location and operational details of the supplier’s factories that provide the required items. Details about suppliers at Tier 2 and below will require extensive detective work, which can be provided by retired librarians and analysts or selected university students. Suitable IT applications will assist to structure and organise the data.
Supply Chains Network Design Review
As the Supply Chains Network map becomes a working document, it is continuously updated so that the data can be analysed at two levels, to:
- Improve the current supply chains
- Provide a response to scenarios that ask ‘what-if’ questions about capabilities of the supply chains network
The Review requires computer based modelling and simulation (now called a ‘digital twin’) capability within the supply chain group to extract useful data. Examples are patterns of data and the Variability of cycles – lead times (including in-transit shipments), rate of materials conversion, production yields etc. Also model the most favoured location for owned and contracted manufacturing, sea and airports for import and export, inventory consolidation locations and transport configurations.
The ‘what-if’ supply chains scenarios process uses the Supply Chains Network Design map data to develop the responses. The diagram below illustrates the process.
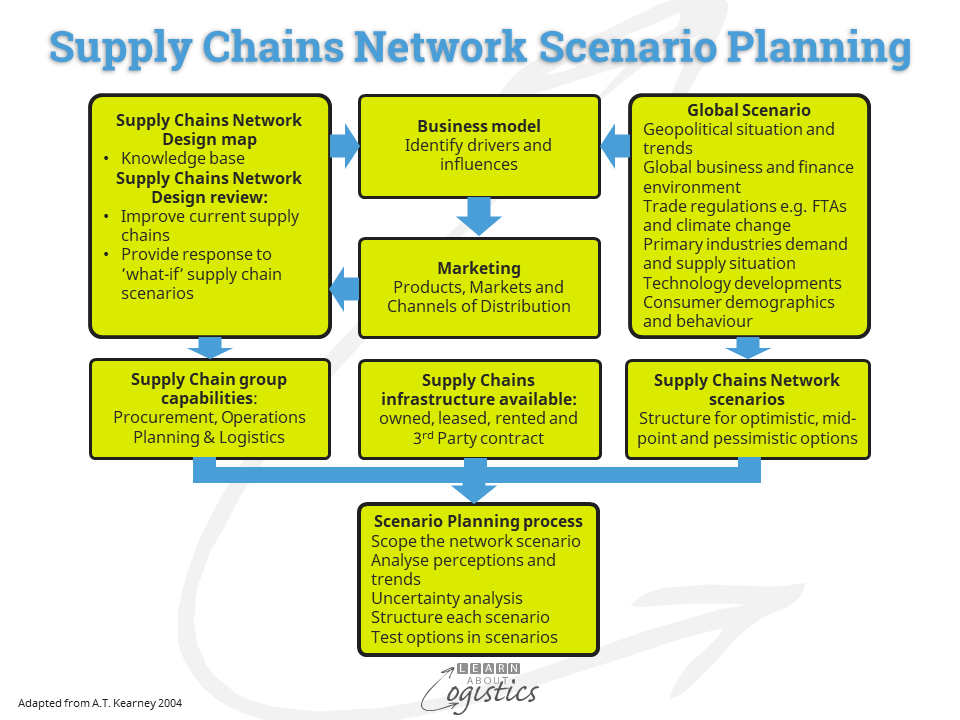
The modelling will assist the supply chain group to identify:
- Risks in the supply chains – external, within supply chains, internal (the enterprise) and supply chain processes. Evaluate risks such as:
- reliance on sole suppliers or single countries
- continuing consolidation of container shipping and airline companies
- ‘fast delivery’ total cost and
- climate change disasters
- How and where in your supply chains is Power exercised – by your organisation; suppliers and customers
- The extent and effects of Dependency in the supply chains by your organisation, suppliers and customers
- Incentives and punishments in your Supply Chains Network concerning price, quality and delivery
- Structure and ownership of data and information flows
Your Supply Chains Network will not become ‘integrated’, as it comprises independent organisations with their own business objectives and policies. Therefore, your organisation’s need is to build knowledge about the Supply Chains Network and the supply markets on which your organisation relies.