
ESG approach to manage risk
The previous blogpost discussed three aspects of Sustainability built into government regulations. In the EU regulation, Sustainability is focussed on the ESG elements of environmental (e.g. climate change), social (human rights) and governance (due diligence) that requires a business to identify, manage and mitigate risks in its value chains.
The ESG risk reduction approach to understanding your organisation’s supply chains has been developed from Supply Chains Risk Management (SCRM) initiatives, which started to gain attention in the early 2000s. However, prior to undertaking risk reduction initiatives is the opportunity to improve the effectiveness and efficiency relating to the Flows of: items, money, data and information through your supply chains. This process is a part of the LEAN approach to operations and the technique of Value Chain (and Value Stream) Mapping, developed since its introduction in the late 1980s, with a formal structure available since the late 1990s.
Each of the legal government directives has a requirement that businesses must understand from where and under what conditions, items are sourced and delivered through their supply chains. This is also required of risk reduction through the Flows. Both use mapping of your organisation’s demand and supply chains, which together provide Value Chains, illustrated in the diagram below.
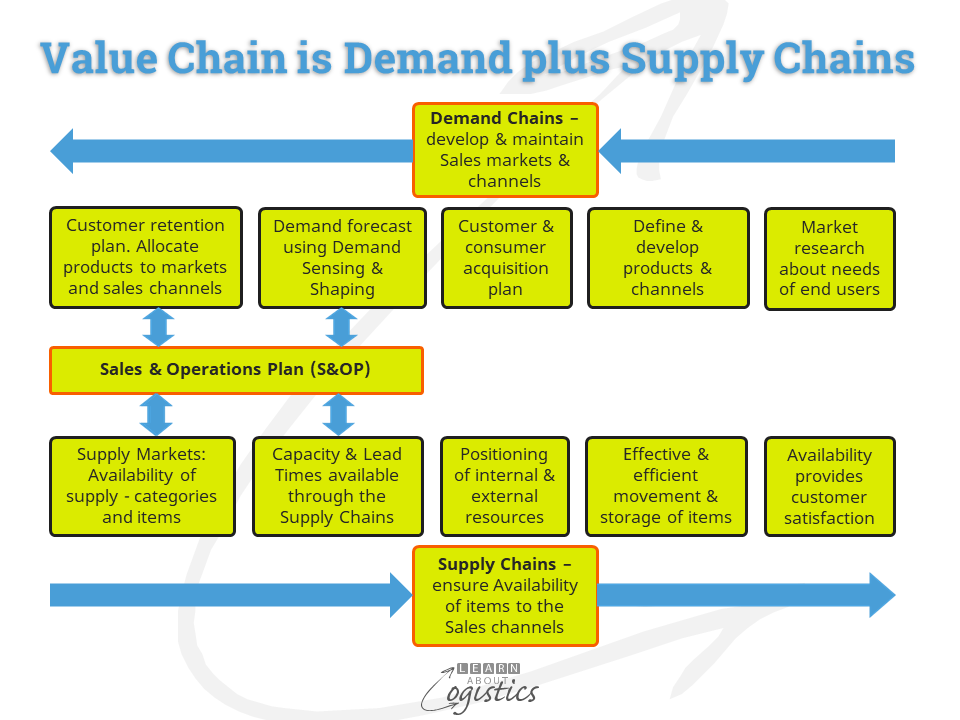
Both approaches require Supply Chains Network Mapping. Although the base data of supplier and customer location and capability is the same, the data required to build each Map then differ sufficiently that a decision is required whether to develop two Maps.
Map Content
ESG risk map: The objective is to develop the ‘big picture’ of your organisation’s Supply Chains Network and so understand the potential ESG risks through the supply chains. The need is to understand the ESG risks of using each material in the end product and the commercial risks of a business relationship with each supplier. To identify the risks of using materials/items, a rating score for each material is calculated. It scores how Vulnerable the business is to the material item and how Critical is the item to the business.
Supply Vulnerability factors:
- Environment, Social and Governance (ESG) adherence
- climate vulnerable in a country or supply location
- climate regulations in a country and compliance with environmental standards e.g. sensitivity to damage of the supply country’s biodiversity
- country climate change mitigation and adaptation actions undertaken and planned
- natural resource inputs, such as water, that are vulnerable to climate change
- compliance with social standards e.g. human rights abuse; exposure to reputational risk
- supply chains cybersecurity risk
- effects on supply from potential disruptions caused by natural disaster events
- Geopolitical risk for the country from which the item is supplied
- Trade barriers that have the potential to be erected against the supplying country
- Political and economic stability of the supplying country
- Reliance on extended supply chains, including distribution routes
- Trade regulations in the supplying country
- Business regulations – extent and expectation of adherence
- Trade regulation effects e.g. duties, dumping and political embargoes
- Technical regulation effects e.g. permits required by the supplier; IT interoperability with a supplier
- Concentration of suppliers, including at tier 2 and 3
- Strategic Dependency on a supplier
- Reliant on a few suppliers located in the same geographic area
- Supply certainty for the input raw material(s). Tier 2+ suppliers are unlikely to reveal the extent of any problems to their customer’s customer
Supply Criticality factors:
- Dependency Definition: if less than three countries can supply a material, or if more than 50 percent of supply for an item comes from any one country and that country controls more than 30 percent of the global market for that item.
- Note: Although there may be dependency on a supplier country, the risks associated with that dependency may not be high, therefore the Dependency score is low.
- Concentration of suppliers below Tier 1: reliant on a few suppliers or there are sufficient suppliers, but they are located in the same geographic area.
- Availability of supply over the long term: Geopolitical risks are high for the supplying country e.g. political stability of the supplying country; trade barriers may be erected e.g. political embargoes
- Vulnerability of supply: Material listed as ‘conflict material’; operational location and long-term supply certainty; price fluctuation extremes. Alternate sources of supply and speed of response to increased orders
- Trade impediments: business regulations adherence in the supplying country; trade regulation effects e.g. duties, anti-dumping tariffs; country regulation effects e.g. building permits for supplier
- Economic importance: importance of the Category or sub-Category in the development of future products; alternate sources of supply available from international or domestic sources; likelihood of new production technologies; substitution for the Category or sub-Category
Flow improvement map: The objective is to eliminate waste (mainly of time) through the supply chains. The data requirements for materials and items are: lead times (including in-transit shipments), rate of materials conversion, production yields, inventory requirements etc.
Physical Flows involve the contracted movement and storage of items by 3PL distribution businesses and different transport modes. Identify the most favoured location for owned and contracted manufacturing, sea and airports for import and export; inventory consolidation locations and transport mode configurations.
Product Platforms identify the groups of products. Because output governs what a business can sell, capacity and capabilities of the constraint resources within operations are identified. Capacity is expressed as a standard unit of measure linked to the constraint resource e.g. tonnes, shippers, litres, hours, pallets, loads etc. Flows may contain multiple time periods, or ‘buckets’, so that seasonality and inventory pre-build needs can be identified.
The Map will highlight bottlenecks, handling and shipping improvements, changes to planning and scheduling processes, and different approaches to Procurement for some items.
For mapping, there are two levels:
- Value Chain Mapping considers the big picture of a company’s Supply Chains Network
- Value Stream Mapping requires additional details for analysing a single supply chain or specific business processes
The legal requirements by governments for large businesses to collect data could lessen the biggest hurdle when mapping. It is that Tier 1 suppliers typically guarantee their products will meet their customer’s performance requirements, but they are usually reluctant to divulge the suppliers of input materials and intermediate assemblies. The same situation occurs at the next Tier and so on. Any change to this situation will require a high level of trust between the trading parties, because they are not ‘partners’!