
S&OP is not ‘software driven’
To achieve success, the implementation of Sales & Operations Planning (S&OP) requires a change in an organisation’s culture towards greater collaboration, managing the implementation of a new process and third, implementation of a software application.
The previous blogpost discussed why your organisation should implant S&OP as the ‘heart’ of the business. This blogpost discusses applications software requirements to assist the S&OP process. Initially, S&OP will most likely use data generated from your organisation’s ERP system and run Excel spreadsheets, email and PowerPoint slides. While these tools do not allow supply chains to be modelled, nor multiple scenarios developed, or answer ‘what-if’ questions, or provide collaborative workflow and exception messaging, accept the limitations. Getting the S&OP process working and changing the management culture is more important.
Specify requirements
It typically takes about six months for participants to feel comfortable with the change in culture and process, so this time should be used to specify the application requirements.
Within the document, always commence with the desired business outcomes, then identify the expected role of the ERP system and its relationship to S&OP. A future system structure should have ERP as the transaction backbone, containing an audit trail of all transactions, plus records for accounting, operations control and HR. Specialist Supply Network Analysis & Planning (SNAP) applications will access the transaction data from the interact with ERP system.
The diagram below provides an outline of the S&OP application software requirements, although the actual requirement for your organisation could differ.
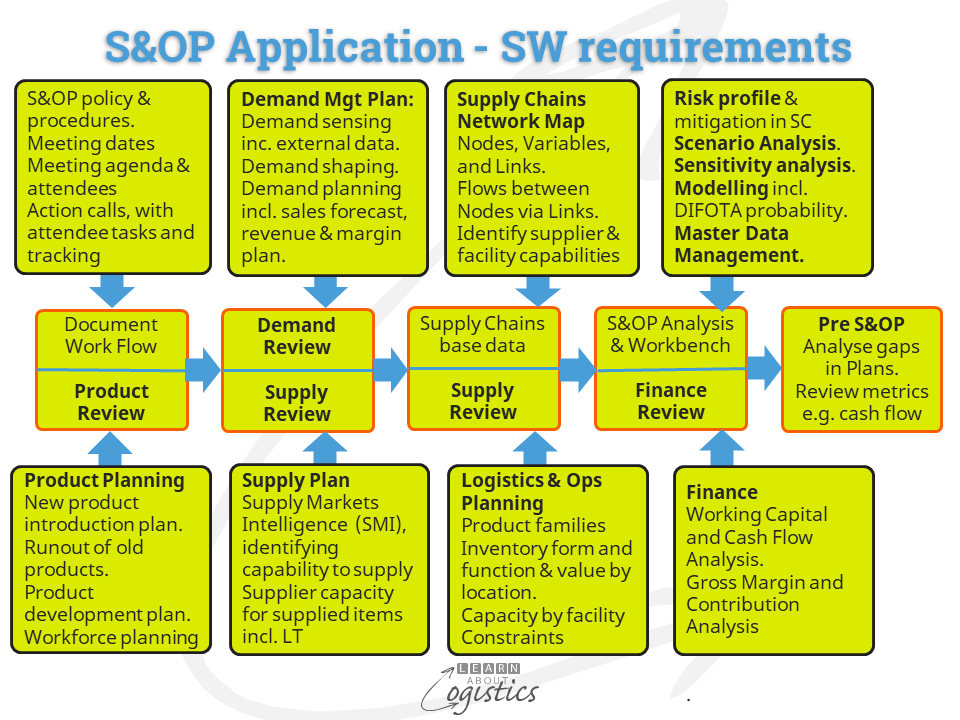
Document Workflow and Facilitate meetings
The administrative level of S&OP, this facilitates the connection of people and information:
- S&OP policy and procedures
- Meeting dates for participant’s diaries
- Facilitate meetings in a S&OP cycle – agenda and attendees
- Action calls, with attendees’ tasks and tracking
- Access to documents and sharing of data between participants
- Aggregate product family data
- Post questions and responses from participants
Product Planning
- Marketing plans for product life cycle: run-out, new and enhanced/upgrade product release timetable and product development pipeline
Sales Planning
- Demand Sensing: buying trends from sales data within each channel. Commissioned market research. External data inputs from social media, weather reports, surveys, etc.
- Demand Shaping: incentive programs designed to increase customer and consumer demand. Includes product promotions, price reductions, trade and sales force incentives
- Demand Planning: estimate of market demand and profitability; includes sales forecasts by product line/group aligned to each S&OP product family
- Pipeline and backlog orders situation aligned to each S&OP product family
Supply Planning
- Supply Markets capability to supply, including current and expected lead times
- Supplier capacity for supplied items
Supply Chains Network Design Map
The Supply Chains Map is the base information that describes the organisation’s Supply Network structure. It has based four elements: Nodes and the Variables that can affect items at a Node; Links between the Nodes and Flows of items, money, data and information between Nodes and Links. The Map provides inputs to Scenarios for analysis of supply chains at each forecast change, or new product introduction and product end-of-life situation.
Logistics and Operations Planning
- Product lines allocated to Product families for S&OP
- Inventory form and function and value by location
- Conversion of product unit of measure to standard unit of measure, for conformity
- Constraints: Material and component; Manufacturing capacity; Distribution capacity; Transport capacity and availability
- Variability of demand and supply by Product family
Finance Plan
- Financial analysis: impacts on gross margin, contribution, working capital and cash flow
S&OP Analysis and Workbench
Improved decisions at the S&OP Executive meeting through understanding the impact of alternatives:
- Master Data Management consolidates date from multiple sources – by channel, customer and gross margin and by multiple time buckets (month, quarter, annual). Process to identify alerts and exceptions in the data
- Modelling to represent Flows through supply chains – see below
- ‘What-if’ (sensitivity) Analysis to identify the most influential variable in a model or scenario
- Scenario Analysis: Create different scenarios e.g. pessimistic, optimistic and most likely impact on the future state of the organisation’s Supply Chains Network Design. This is based on assumptions about product mix, new product introduction and end-of-life timings
- Simulations: run multiple scenarios to predict how a system or process will perform under different conditions and the impact of risks and opportunities. This provides for Predictive Analysis
- Workbench Output Plan for the next 3-9+ months horizon, to achieve a Demand – Supply balance, based on inputs from the above analysis
Modelling: the types of data inputs for the models concerning supply chains are:
- key features of the supply chains (e.g., demand and demand variability, such as:
- seasonal variability on inventory, capacity and resources
- achievable product mix
- capacity and inventory in manufacturing, warehousing and distribution
- demand push and pull decoupling points
- locations for postponement inventory
- DIFOTA (delivery in full, on time, with accuracy) probabilities
- trade-offs between purchasing volumes, material costs, production throughput, labour, warehouse capacity, transport availability, promotions and inventory etc.
- constraints through the supply chains:
- policy e.g. inventory investment, sustainability requirements
- physical e.g.
- demand fluctuations and inventory buffers,
- critical suppliers’ availability
- critical capacity and lead times,
- product mix impact on factory throughput,
- effective use of production lines, departments or machine groups
- equipment maintenance requirements, labour availability by skill level
- financial e.g. working capital and cash flow
- costs associated with demand and supply chains e.g., discounts and promotion activity, fixed and variable costs, marginal contribution and opportunity costs, input materials cost fluctuation, supplier volume discounts
Much of the data required will be maintained within individual SNAP applications. Examples are supply market and supplier details maintained in the Supply Markets Intelligence and Sourcing Plan.
As data used in S&OP is available from multiple applications, Master Data Management is required to ensure that inputs are accurate before uploading to the S&OP Analysis and Workbench. This requires evaluation of customer and item masters, including names, addresses date format units of measure, time horizons, bill of materials (BOM) structure etc. Also, the levels of accuracy required (gross margins, inventories, capacities, service levels etc.), as items are rolled-up from product line level to their S&OP ‘family’.
Not an IT project
A rules-based model that makes assumption about how a business should work is not required. Instead, the software application need could be a ‘fill-in the blanks’ design. The organisation’s data can then be analysed and used to build operations/finance models, scenarios and answering ‘what-if’ questions.
Of late, the term Digital Twin (DT) has been used with reference to planning. but this is not the correct use. DT is a digital replica of the physical environment. It therefore requires connection to measurement equipment and sensors for online data collection through SCADA (supervisory control and data acquisition) systems. DT is best applied to simulate the Sales & Operations Execution (S&OE) plan and schedules.
S&OP is NOT an IT project, as a positive return on investment (ROI) cannot be calculated; but the investment in applications used to assist people to make relevant decisions is very important. Also, time is required for modelling and simulation software to be understood, selected and implemented before the benefits can be measured.