
Demand Amplification
Amplification of demand through a supply chain exists when the orders placed on suppliers have a higher variability than for sales made to buyers. Although this has existed for a long time, it was formalised in the late 1950s by Jay Forrester, and later promoted as the ‘Bullwhip’ effect by Hau Lee in the 1990s. The main causes remain current, although identified seventy years ago:
- Demand signals: demand forecasts are updated based on customer and internal (sales) orders and shipment data, with little input of external data from the sales channels
- Visibility through supply chains is limited: It results in Uncertainty, leading to ‘Just in Case’ thinking. This is due to an inability to account for Variability, Constraints and Complexity across the Nodes and Links of an organisation’s Supply Chains Network
- Fluctuating demand can result in underutilized capacity or production bottlenecks that influence actual lead times
- Fluctuations in demand can affect relationship with suppliers, especially if they may not be capable of responding to large variations in order quantities
- Supply uncertainty: Due to possible supply delays and variability in supply quantities
- Order batching: generate orders from IT system on a period basis (weekly/monthly) using static safety stock rules; ‘hockey stick’ sales patterns, where most sales are at the end of month to align with invoicing, or overstocking at month and year end to meet sales and production targets. Combining orders to meet volume efficiency targets and order batching due to delays (latency) in a supply chain:
- Demand latency: The time taken from when an item is sold to a customer/consumer until the order for replacement items is processed
- Data latency: The time taken for data to move internally and between a potential of increased number of Nodes in a supply chain, due to outsourcing
- Data latency and a lack of data synchronization can amplify fluctuations in demand as the requirements move upstream
- As each party in a supply chain typically acts independently to optimize its own operations, it is unlikely to consider the effect of decisions on other parties; this reduces responsiveness through a supply chain
- The further upstream in a supply chain is a business, the more critical to understand the consumption trends of end users
- Price fluctuation: involves ‘deals’, such as volume buys (also called ‘investment buying’), where a lower unit price is offered for higher purchase quantities
- incurs storage expenses and increases working capital that affects cash flow
- Rationing and shortages caused by large buying orders: customer service decreases if some customers must be rationed to satisfy a large order from one customer. Rather than managing capacity, this can cause Operations Planning to increase lead times
Pressure has been applied to Supply Chain groups (Procurement, Operations Planning and Logistics) for less inventory to be held. But more inventory is required (cycle inventory, in-transit inventory and safety inventory for supply items) to cover factors such as outsourcing and the ‘long tail’ of products that appeal to small markets.
To resolve these conflicting pressures, Operations Planning can calculate the Demand Amplification for their business. The results are used to illustrate (for senior management), that supply chains require upstream stability for effective tactical planning. This enables the operational schedules to satisfy downstream customer orders or sales forecasts.
Calculate Demand Amplification
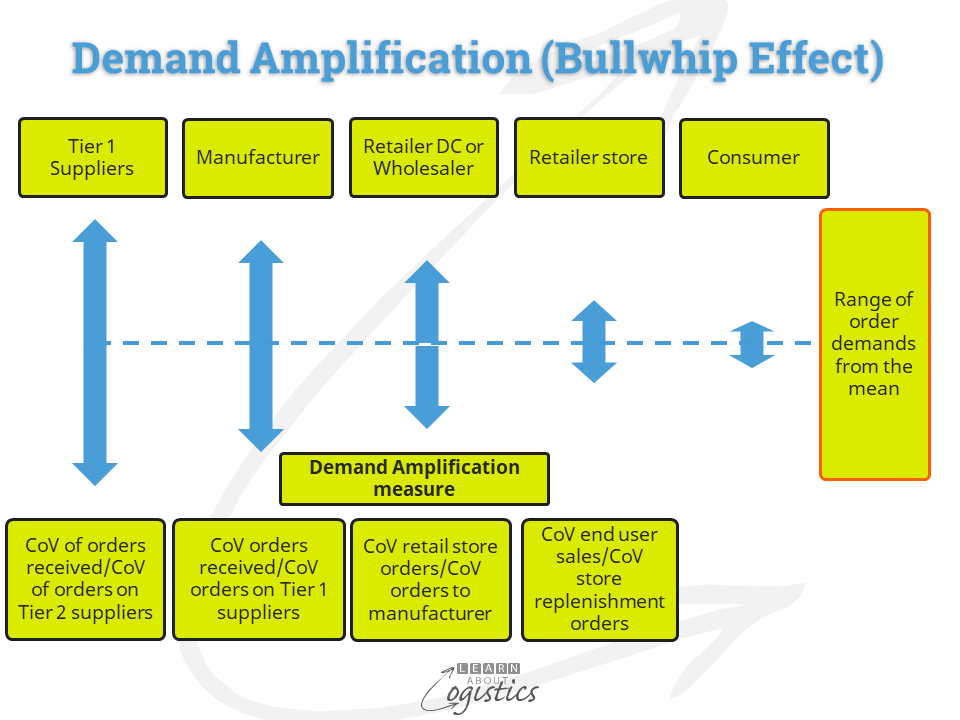
The diagram below illustrates the Demand Amplification (Bullwhip) effect and the calculation of Coefficient of Variance (CoV) required at each Node of a supply chain. As each Node is autonomous, each calculation is unlikely to be shared with other Nodes in the chain, but that should be an objective.
An example of a CoV calculation is shown in the table below. A blogpost written in 2020 by Fred Baumann provides a step guide to the calculation.
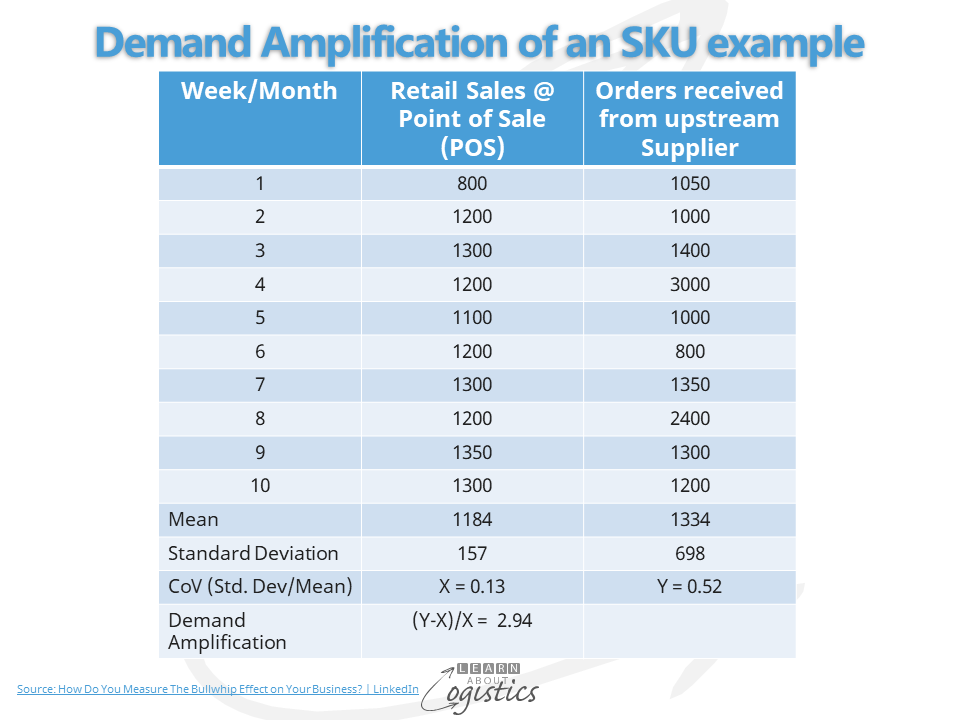
The Demand Amplification of 2.94 indicates an ‘under control’ situation for the product line. However, it is the trend rather than absolute figure that is important to review. To have a decreasing demand amplification indicates an improving responsiveness to customer demands. This requires initiatives by the Supply Chains group to reduced the lead times that can be influenced. Examples of initiatives are:
Relations with customers – review the pattern of sales and customer orders and discuss the effect with Sales:
- Increased sales at the end of month – ‘end of month rush’
- Overstocking at the end of month/year to meet sales and production targets
- Payment terms used by customers as order triggers
- Pricing and price/payment incentives that influence order quantities
- Any fixed costs and ‘economies of scale’ cost structures that encourage large, irregular orders
- Calculate the Cost to Serve for categories of customers
- Consider an Available to Promise (ATP) application as the customer service tool
Product design – discuss with Marketing and Engineering:
- Design products for commonality of parts or ingredients
- Enable a delay to the differentiation of SKUs (that is Postponement)
- Identify product lines for rationalisation – reduce the cost of complexity caused by the ‘long tail’ of low selling SKUs
- Identify lot and batch size reduction
- Evaluate the use of ‘quick changeover’ tooling for finishing and packing equipment, to enable a faster response to customer demands
Operations Planning:
- Where possible, link Operations Planning directly to external demand signals e.g. if supplying to retail, use retailer’s point of sale (POS) data
- Implement inventory control policies e.g. promote vendor managed inventory (VMI)
- Implement Sales & Operations Planning (S&OP) as the tactical planning process for the business
- Use ‘Scenario Planning Analysis’ and ‘Predictive Analysis’ as Risk Management tools to identify potential disruptions in supply
Suppliers and Customers: Identify where and how to improve trust and contractual agreements. Identify improvements in relationships with non-key suppliers and customers
People: Align management incentive or bonus payments to the required performance objectives – so that ‘we behave how we are measured’
These initiatives are required for senior management to be comfortable with the knowledge and performance of the Supply Chains group. This enhances the opportunity that Planning at the Tactical level will be the corporate guide for Scheduling at the Operational level. This will help for management not to be influenced by the promotion of ‘new’ technologies and that fast manipulation of massed data at speed in the ‘cloud’ provides the best outcome – it doesn’t, because a business becomes more reactive.