
Cost of holding inventory
There is not a ‘right’ decision about the level of inventories that work best for your business. However there is a need to know the cost and potential for cost reduction from decisions about inventories.
To cover for unplanned events, an organisation can reduce its total operational costs by holding a calculated ‘safety stock’ in excess of cycle inventory. However, there is a cost incurred from holding inventory and the table provides a list of the most common inventory costs.
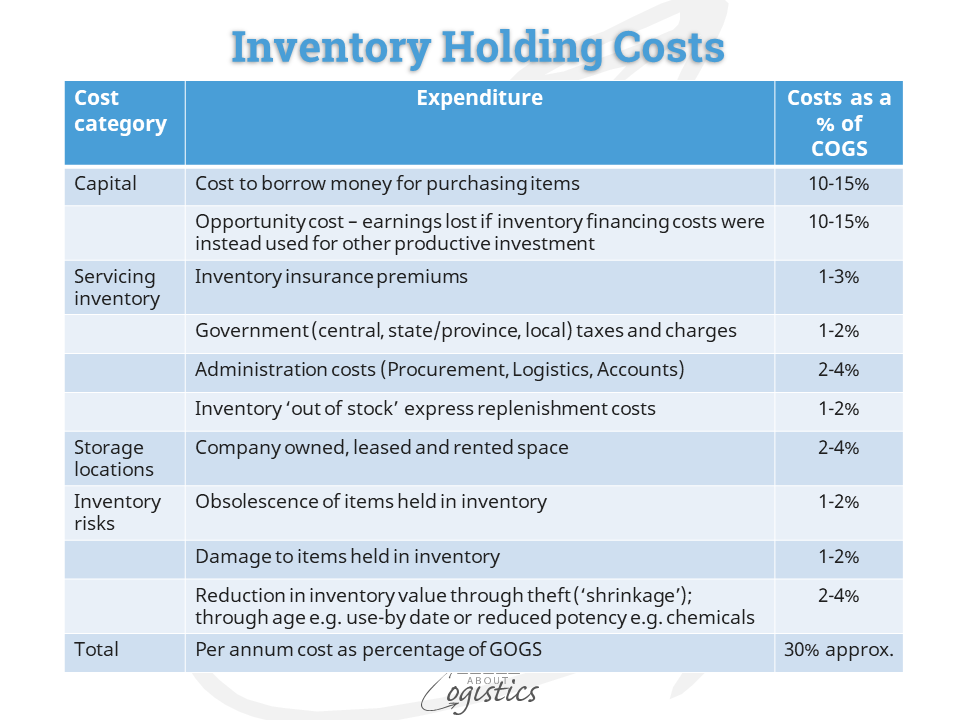
The total cost could be in excess of 30 percent of COGS per annum, but as shown in the diagram there is a wide range. An easy to remember (and justify) figure is an inventory carrying costs at 24 per cent per annum. That is 2 per cent per month of the inventory, valued at pre-sales cost.
Costs must be evaluated against their relationship to service levels. Shorter lead-time requirements for finished goods can increase transport and inventory costs. If a business reduces its delivery time from two days to overnight, the transport cost to provide the improved service will increase, making a more decentralized network more appealing, even though inventories will increase. The more distribution centres or warehouses in a network, the higher the total safety stock of inventory, due to increased uncertainty concerning customer demands at each inventory location.
The complexity of an organisation’s supply chains network extends to Tier 1 suppliers and their suppliers. So, in addition to the inventory holding cost are commitments made to the organisation’s suppliers and therefore the associated liabilities (A/P). One of the financial objectives of outsourcing is that a business can delay when it takes ownership of inbound inventory, so the value shown in the accounts is reduced. But, while there is less inventory value shown in the accounts, there is not less inventory risk.
Performance measures for inventory
The typical performance measures (metrics) used for inventory are ‘after the event’ (i.e. lagging indicators), such as inventory turns, inventory days of supply, slow and obsolete (SLOB) etc. When adverse events in demand or supply occur, it can take weeks for the metrics to identify any resulting problems. Therefore, to be more proactive, businesses should also measure inventory risk as a ‘leading indicator’, which is called Inventory Exposure.
In 2006, John Holton defined Inventory Exposure as “the amount of committed inventory within an organisation’s supply chains, based upon the expected demand and cumulative lead-times”. Inventory Exposure represents the amount of money (although not necessarily paid) at risk in the inbound supply chains at any given point in time. The metric is Inventory Exposure = Price x Orders x Cumulative Lead-Time calculated for each item and intermediate component. The sum of the individual calculations can be ‘rolled-up’ to identify the exposure at a product, product line, or company level.
The important element is the cumulative lead time. Materials go through a set of steps that add value as they are transformed into a product. Each material purchase and subsequent value-added steps have an associated lead-time. The start date for a final assembly production order is the due date for delivery of lower-level assemblies. The start date for lower-level assemblies is the due date for their input materials and assemblies and so on, as the timing cascades back through the supply chains.
At the time when a buyer places the order for an intermediate item or material, there is a financial exposure and therefore risk. If a Vendor Managed Inventory (VMI) program is used with some suppliers, they will locate inventory based on the contracted window of time in the forecast. The buyer company therefore assumes financial exposure and risk when it sends the forecast. In both situations, the cumulative lead-time is the mechanism that determines how far in advance action is required to support the planned requirements.
The measurement to use aligns with ‘inventory turns’ as Inventory Exposure Turns = Cost of Goods Sold (COGS)/Inventory Exposure. An additional measure is to identify the ’50 percent point’, when the exposure to future inventory for a product line is more than 50 percent of orders or forecasts sales at COGS value. The situation can be represented in a ‘Product Time-Investment Curve’ chart that shows the increasing money invested in a product over time.
Inventory Exposure is a measure concerning financial exposure that will ultimately lead to inventory held in the business. In addition to financial risk, Inventory Exposure can identify opportunities to reduce the risk profile through reduction of inbound lead times or convincing customers to extend their order lead time.
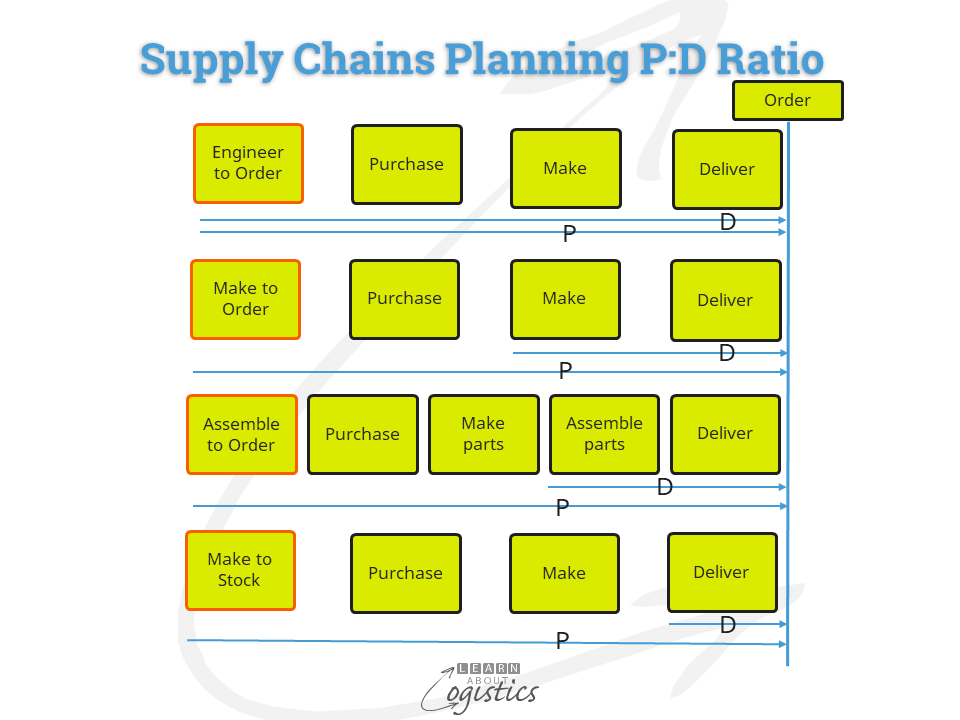
P:D Ratio
For a finished consumer product, the demand time ‘D’ is the ‘deliver cycle’ – the time to accept the order, pick and pack, then transport to the customer. For replenishment of inventory there are the cycles of ‘make’ and ‘purchase’ – the total throughput time of ‘P’. The P:D ratio indicates the purchasing activities that are speculative, with expectation of receiving a firm order for the finished product. The higher the ratio, the more speculation and therefore risk.
Within the lead time are value-added steps – the actual time when value is being added. The difference consists of waiting and transit times. The portion of lead-time that is consumed by non-value-added steps is linked to how effectively product flows, constraints management, batch sizes and production set-up times are managed.
To reduce lead-times, the supply chains group (Procurement, Operations Planning and Logistics) need to know the flows of materials and components and where and when they are differentiated. This provides opportunities to reduce lead-times using a combination of strategies, ranging across: contracting with suppliers that are nearer to the receiving point (e.g. near-shoring and on-shoring); holding strategic buffers of inventory at low-cost locations; postponement planning; improved information exchange with suppliers and Logistics Services Providers (LSPs) and negotiating reduced P:D ratios with suppliers.
The cost of holding inventory is an important element when calculating the total cost of ownership (TCO) for purchased items. Using an Excel spreadsheet to calculate the costs for holding inventory and ownership will quickly become redundant. The task requires investment in an IT application that can hunt through multiple applications on a regular basis, to update the actual cost figures for many products.