
Uncertainty or scenarios
Uncertainty in supply chains has become a term without meaning, as few events of consequence are certain. Supply chains have become less reliable and goods and services could have availability issues, due to geopolitical disruptions and climate change events that are converging. But there is unlikely to be a technology or technique that knows with certainty what will happen in the future.
The fall back option is therefore to place ‘degrees of confidence’ on possible outcomes from scenarios and design a strategy to address the most likely; but have the capability to adapt if the situation changes. This approach underpins Supply Chains Risk Management. But to enable the analysis of a scenario, there must be a planning process in place. And this requires One Plan for the strategic business units (SBU) or profit centres of your business,
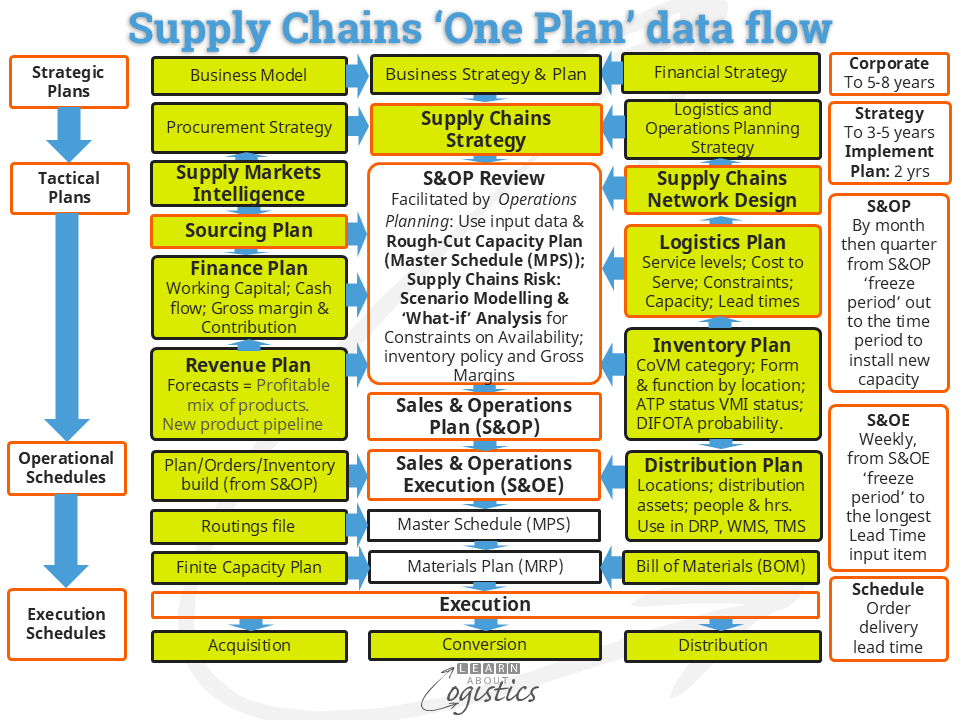
Not all the elements in the diagram are necessarily required and the terminology used can be different, even though the intent is the same. So, use the One Plan diagram as the base from which to develop applicable ‘one plans’ in your organisation. Features of the One Plan will be discussed in future blogposts.
Why have a One Plan?
An earlier blogpost discussed the structure of One Plan. When parts of a business are using different datasets, time is wasted to reconcile versions of the data; so, having a One Plan provides a single source of truth for operational data. It is also of value to emphasise that:
- Planning is thinking into the future regarding the activities required to achieve a desired goal. For a business, it is to have achievable outcomes that serve customers. This is to be Effective
- Planning and Scheduling must be differentiated, to identify and enable:
- different data and information to be analysed;
- different time horizons for decisions and
- effective use of management’s time
In articles written by American authors, the activities of Planning and Scheduling are typically combined under the heading of Planning. Therefore, while comments are discussed under the heading of Planning, some actually refer to Scheduling.
The One Plan diagram illustrates the ideal flow of data and information in an organisation. However, we are all well aware that the flows are not always just between software applications or machines. In some instances, the flow is via emails with attached spreadsheets or physical paper, whereby the data must be re-entered into another application. Accepting whatever limitations there are, having a One Plan provides a common reference for all who need to know.
Data latency and granularity
At each stage of the business, the planning or scheduling horizon changes, so the granularity of the data will change, from years and quarters to months, days and hours. With reductions in time horizons, so the latency of data delivery must also be reduced, from quarterly and monthly forecasts that access market data, with various time lags (or data latency) in collection and publication, to near real-time acquisition at the execution stage.
Demand data latency is the time taken from data collection to its beneficial use e.g. the time from a purchase in a sales channel to translate the demand signal into an order on the supplier for delivery. Adapted from Supply Chain Insights
Latency in data collection and transmission can skew the dataset, which leads to forecasts that do not reflect the actual situation. This can cause over or understocking of products and items; incorrect resource allocation; inefficient use of resources and costs of expedited transport and overtime payments.
Integrated or Interfaced?
Most often encountered in business organisations is one or more corporate Enterprise Resource Planning (ERP) systems, which contain modules designed to ‘integrate’ operational plans, resources, money and people. Over the years, the major software suppliers have promoted an ‘integrated system’, but outside the traditional ERP system, this has rarely occurred. The One Plan diagram can be used to identify the gaps in data flows, with solutions provided by various software suppliers, so interfacing applications becomes a potential challenge.
SNAP – Supply Network Analysis and Planning is the Learn About Logistics term for these additional software applications. The table below suggest the range of applications and tools that align with the One Plan planning and scheduling horizons of Strategic Analysis and Planning; Tactical Analysis and Planning and Operational Schedules. The SNAP analysis applications and tools can be implemented in months; while the more complex planning applications will take more time.
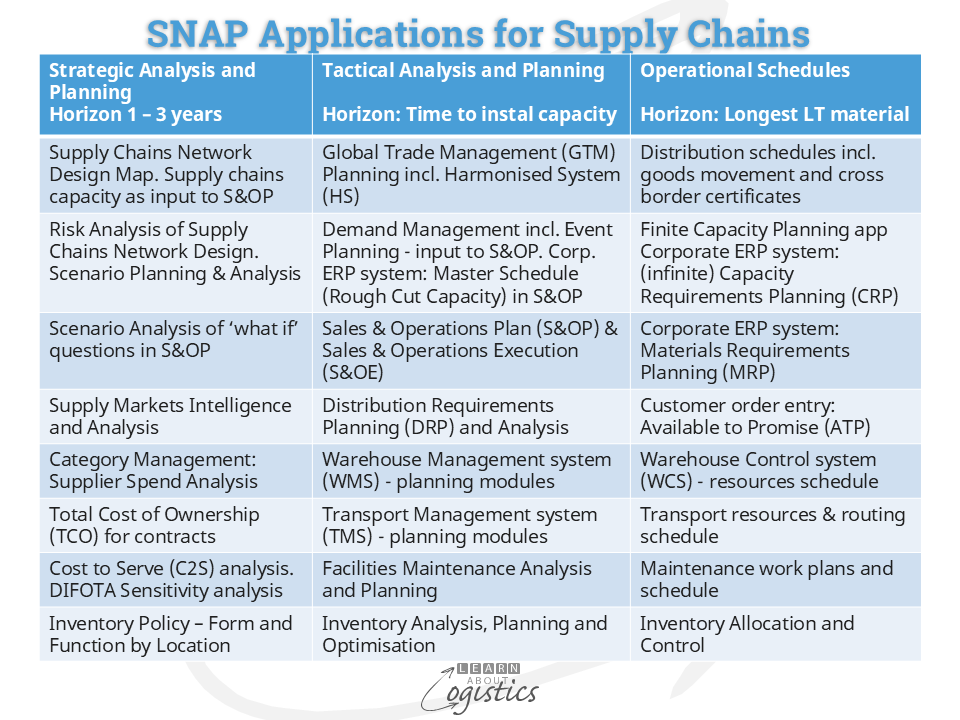
SNAP applications are not required to be ‘integrated’ with applications that serve other functions in a business. As organisations must increasingly respond to Emergent events, flexibility is maintained through ‘Interfaced’ (or connected) SNAP applications that maintain their own data structure. But they synchronise with the ERP database for exchange of data and information.
An example is Working Capital requirements and Cash Flow that can be affected by decisions in the Sales & Operations Planning (S&OP) process concerning: Throughput; Capacity (owned and contracted); Inventory (form and function by location) and Lead Times, with each affecting the others. This has financial implications that are resolved in the ERP Finance module.
At the Strategic and Tactical levels, data and information in SNAP applications is used on a ‘time phased, need to know’ basis – not instantaneous. There is also the potential of access to unstructured data streamed from: social media, demographic maps, weather sites and customer feedback (including warranties). But again, these do not require instantaneous, on-line access.
At the Operational Schedules level, data can be downloaded from the Warehouse Control System (WCS), and streamed from Material Handling Equipment (MHE) and automatic identification and data capture (AIDC) instruments for automated analysis and reporting. The consolidated information is provided to schedulers on a ‘need to know’ basis.
Reviewing the SNAP table, there are examples of applications that have the potential for interfacing:
- At the strategic level are: Risk Analysis of Supply Chains Network Design with Scenario Planning & Analysis. In Procurement: Supply Markets Intelligence, Category Management and Total Cost of Ownership
- At the tactical level: Distribution Requirements Planning (DRP), Warehouse Management System (WMS) and Transport Management System (TMS)
- At the Operational Schedules level: Available to Promise with Inventory allocation and control
Industry is now more dependent on their supply chain networks, so planning and scheduling of operations must be more structured. To start this project, develop your organisation’s One Plan and identify the range of SNAP applications that are required to complete the One Plan structure.