
Long tail of inventory.
Currently, media articles are discussing the potential changes to business and the wider community from the implementation of new technologies. But fewer discuss the potential changes from implementing different business models caused by changes in markets.
A recent comment noted that order sizes on Asian fabric mills have decreased by between 20 and 30 percent over the past three years. The cause has been the addition of SKUs to retailer’s apparel inventory lists, addressing product requirements in smaller niche consumer markets. These extended SKUs are called the ‘Long Tail’, a concept identified in the mid-2000s, which can force a change in the business model of affected organisations through a supply chain.
Developing a ‘long tail’ inventory list can occur in any consumer packaged goods (CPG) or fast moving consumer goods (FMCG) enterprise. Long tails have attributes of:
- Lumpy demand: In comparison with high volume items that have a fairly regular and predictable demand pattern; slow moving items have a lumpier and unpredictable demand pattern that is not a normal distribution. Therefore, the traditional inventory techniques of safety stock calculation based on normal demand distribution, is insufficient
- Intermittent demand: The driver of replenishment has moved from main and secondary distribution centres to the retail shelf. Consequently, there is a more intermittent demand pattern from multiple stock holdings
- High service levels: Some products in a long tail are considered important, as they can be new product introductions, often heavily promoted. There is an expectation of high service level – about 98 to 99 percent. An early ‘guru’ in statistical forecasting, Bob Brown, stated that “…if you want to aim for 98% to 99.5% service, there can be a large difference between the safety stock theoretically required under a skewed distribution and that required if the forecast error is normally distributed”
This means that complexity will increase if ordering, manufacturing and distribution processes do not change. This is due to the more uneven re-ordering patterns and the product replenishment time (from the inventory or sales trigger to receipt of new stock) – remember the Bullwhip Effect. The result is that replenishment orders are not a representation of actual demand; therefore are less responsive to changes in demand patterns.
As order size decreases, but total delivery volumes increase, lead times in supply chains can be shortened to make them more responsive. This will require supply from ‘agile’ factories and distribution centres that could be close to customers. While this option may be more effective and provide a lower total cost, big changes take time.
For example, throughout Asia, factories were established to produce large volumes of fairly basic items. Re-engineering their business to meet a new pattern of demand could be too expensive. And even in factories producing more complex items, it is a long-term process to implement new processes for planning and to modify equipment change-overs and material handling.
The added complexity at suppliers will likely increase costs. As an example, labour costs were increased by fifty percent at a new Store Ready Merchandise (SRM) apparel replenishment centre in Shanghai, due to the added risk associated with each store order pick being different. This required a higher level of staff training, English language skill and employee alertness, therefore higher wages.
Structure your inventory
If forecasts are not within an acceptable range in the short to medium term, then implementing ‘better’ (new technology) planning systems will not improve the situation. To improve your current processes, segment the inventory by the variability of demand (demand predictability and order size). This is illustrated below:
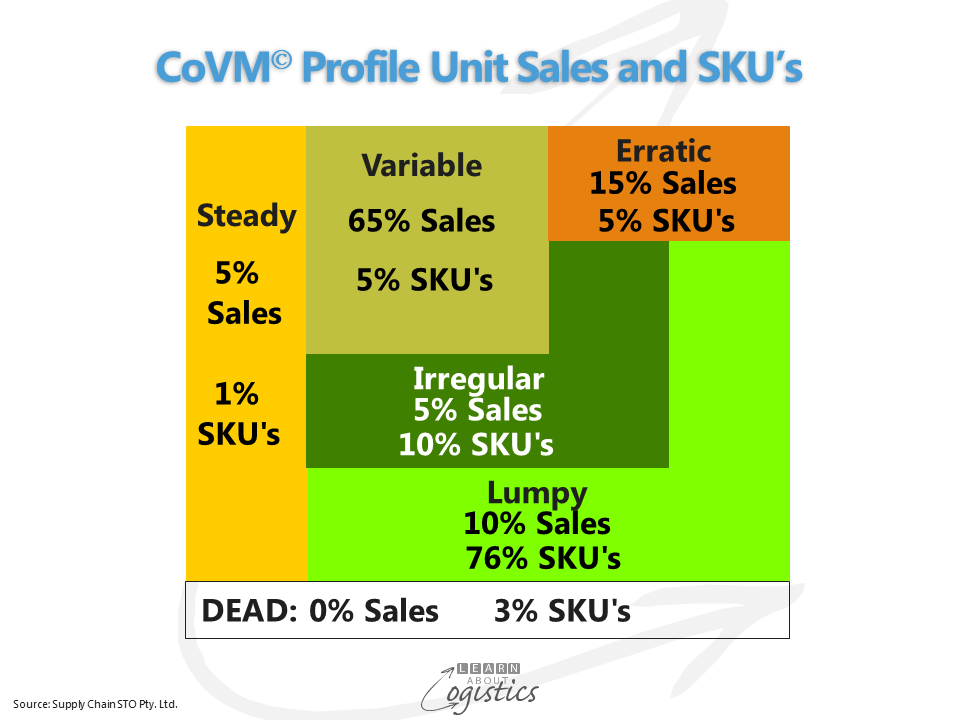
Each of the six inventory groups has a descriptor; plus an approximate percentage of SKUs and the equivalent percentage of sales. These percentages are not fixed, but provide a reasonable indication. List the SKUs in descending order by annual sales and divide into Categories. Then calculate the coefficient of variation for management (CoVM) by dividing the standard deviation of each SKUs annual sales by its mean (average) sales. This identifies the class within its category for a SKU:
- a = less than or equal to 0.25
- b = greater than 0.25 and less than 0.50
- c = greater than 0.50 and less than 0.75
- d = greater than 0.75 and less than 1.00
- e = greater than 1.00 (for assemble to order ATO items)
- f = greater than 1.50 (for make to stock MTS items)
Manage your inventory
It is evident that different management approaches are required for each category, based on the pattern (descriptor) of demand.
Efficient and low cost customer response and supply capability
STEADY: Forecasts will be close to actual sales, with a low variability of demand and therefore supply. A high service level will not require a high safety stock for ‘make to stock’ (MTS) items. Manage inventory through the Tracking signal of about 4.0. This is calculated for each SKU by dividing the cumulative variation for the number of periods under review, by the standard deviation of sales
Agile/ responsive supply chain design
VARIABLE: due to variable sales, the calculated forecast error of the SKUs in this group requires watching. Review the required customer service levels. The trigger for a review of forecasts for a SKU is a tracking signal of more than 7.0. Implement agility strategies, like postponement, flexible manufacturing and agile supply.
ERRATIC: contains individual SKU items that have substantial sales, but volumes can vary dramatically. This is a challenge for logistics professionals, because the timing of a large sale may not be communicated. Logistics should therefore work with Sales to understand the causes of variability for each SKU. Often, the sale of these products is to a small number of customers, so together with the sales representative, visit the customer and find out about their business and discover why their buying pattern is erratic
IRREGULAR: usually purchased by customers in small quantities on an irregular basis. The number of SKUs in this group is similar to the total of the previous three groups, yet constitutes only about 10 per cent of sales. As customers may demand a full range of items, Logistics should consider different ways of supplying these items. Outsourcing production to a smaller company may be a solution. If the item is imported, often with minimum order quantities, review the item’s customer service level and the gross margin return on inventory investment (GMROII). This is calculated by multiplying the current gross margin by the annual inventory turns, divided by 1 minus the gross margin
For Variable, Erratic and Irregular items, initiate or review the location of items in sales channel(s)and their cost-to-serve. If available, use unstructured (internal) text data, consumer social media data and consumer loyalty card data to improve understanding of demand
LUMPY: can contain up to 70 per cent of all the SKUs, yet only about 5 per cent of the sales value – rarely ever more than 7 per cent. Eliminating this group of items is a major challenge in the FMCG and CPG sectors. A SLOW moving SKU has not registered any sales for six of the preceding 12 months. A product elimination process must be an integral part of the inventory management process. Consignment stock (also called Vendor Managed inventory (VMI)) is an approach
DEAD: SKUs without any sales in the past 12 months are obsolete. If the SKUs are not ‘insurance’ service parts, they should be eliminated from the sales catalogue
Structuring your inventory by category/class is an early step in developing a better understanding of how to respond to changing market demands. While the potential of new technologies sounds promising, without believable base data, the technology is not worth the money paid.